Memphis Corporate Community Leadership Measured

  • ABOUT
  • MWBE
  • SOLUTION
  • IT’S WEIRD
  • RESOURCES
  • CONTACT
  • MRYE

WORKFORCE DEVELOPMENT IS ECONOMIC DEVELOPMENT

May 28, 2019 Joe B. Kent Uncategorized

WDisED3

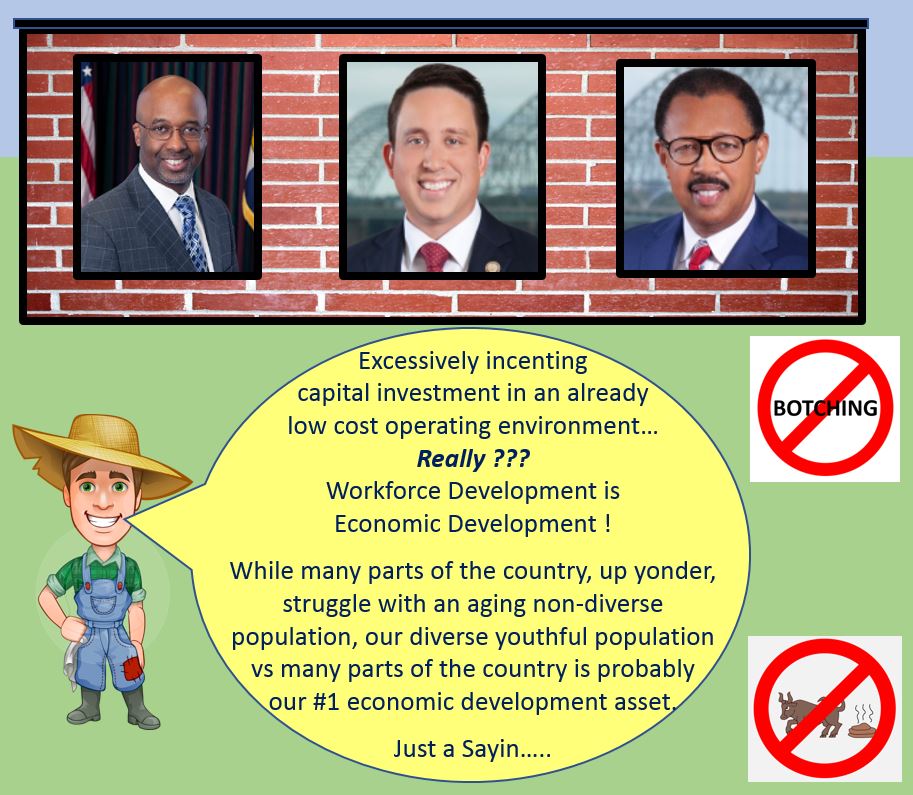
“Repeat after me: Workforce Development is Economic Development” is an article  that just appeared in the Daily Herald Business Ledger of suburban Chicago. Authored by Jim Morgan, Vice President of the The Management Association, the article stresses workforce development as paramount in fueling economic growth.

The upper Midwest is especially challenged with an aging population and lack of diversity which threaten area growth. These are challenges not pressing in Memphis with a diverse youthful population as a key economic development asset IF developed.

In the article, Morgan mentions a discussion, five years ago, with a manufacturing CEO that stated, “Talent is my pacing item. Talent, or more accurately the lack of talent, is determining how much product we deliver, how many shifts we employ, and how fast we grow. It is not capital expenditures, financing, transportation, or rules and regulations. It is people.”

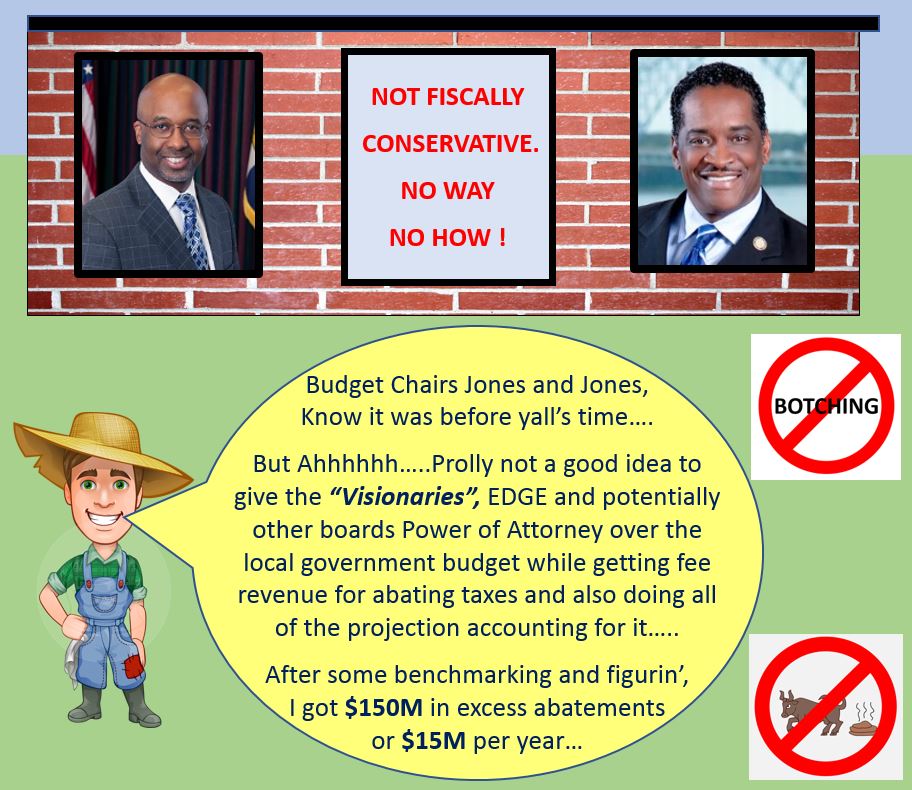
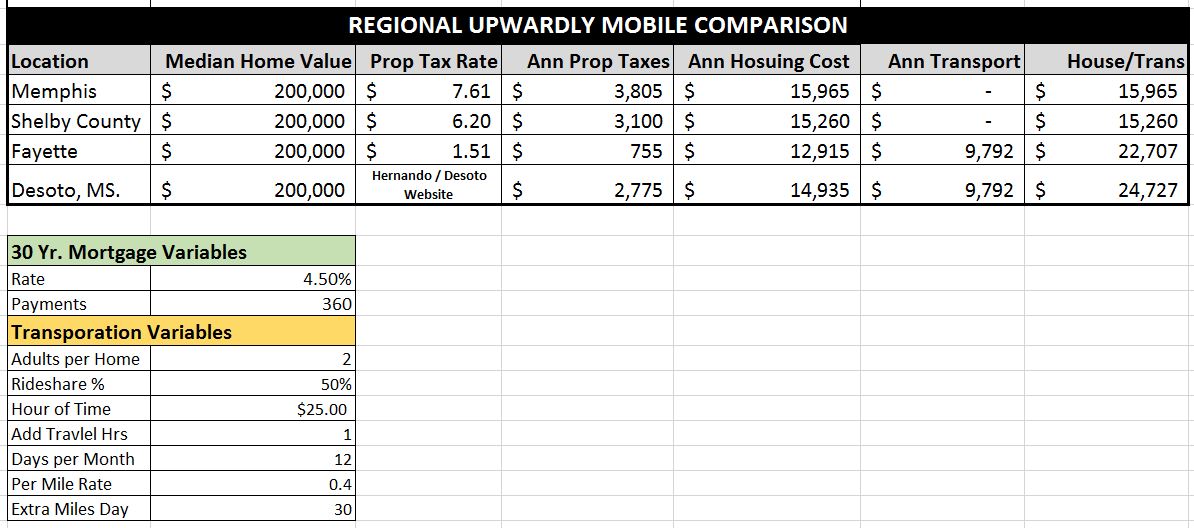
Meanwhile, over the past five years in Memphis, local “Visionaries” went on a bender incenting capital investment in an already low operating cost environment. It resulted in an implementation of corporate socialism that unleashed a brand of fiscal liberalism occurring under the the labels of “government efficiency”, “economic development” and “a better tomorrow for all”.

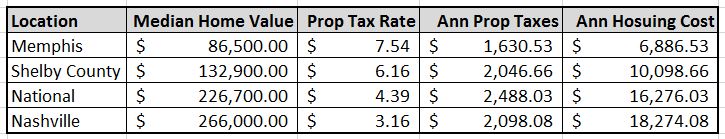
But, operating costs, which includes a high property tax rate, never was the problem. Memphis “visionary” efforts prioritized corporate/real estate development as economic development leaving the key drivers of any local economy in small business and workforce development behind while fending for themselves in a “free market” economy. Such a policy environment has gone only to serve a small few while not serving the overall business community.

Hopefully, priorities and the policy environment are changing under new Chamber leadership and the establishment of The Shelby Regional Economic Development Alliance. Morgan goes on in the article to mention several tactics that employers can use in helping to improve workforce development which, in part, includes: 1) educating students of career opportunities in the region and 2) developing programs to improve education and educating at-risk populations.

Common Language is Fundamental (Data and Assessment)

Common language development is the bedrock of improving workforce development through improved communication and educational programming. Common language enables employer customers of the workforce development system to effectively communicate their workforce development needs with the education/workforce development system within an academic setting. Academic settings are rich with regulatory and academic language often making it difficult for non-academic practitioners to effectively communicate their workforce development needs.

To that extent, common language supports are needed to bridge the language barrier to address workforce needs starting in the academic curriculum while proceeding through the career/vocational and degree programming landscape. Common language supports start with discrete skill employer demand data that gets everyone on the same page regarding in demand skills. This would most cost effectively and expeditiously commence with a publication of authoritative public data. Once the public data is reviewed, any concerns, would inform the targeting and administration of more expensive and laborious data collection through local surveys which may not be necessary with the publication of reputable and authoritative public data.

Next, two forms of assessment would be identified in standardized and diagnostic assessment to further support common language implementation. Standardized assessment would include basic skills (reading, math, and etc.) assessments profiled against occupational requirements to determine student foundational skill readiness and industry certification assessments (which is currently happening) to determine specific vocation readiness for employers. Diagnostic assessments such as interest and workplace preference profiles help guide student career pathway exploration and planning work while alerting employers of a candidate’s personal preference and interest alignment with available career development opportunities and job openings.

Examples of basic skills standardized assessments include ACT WorkKeys, recently written about by Ted Evanoff in the Commercial Appeal. A lesser known basic skills assessment, but similar, is the National Work Readiness Credential (NWRC). All of the above goes to support the deployment of common language that gets everyone on the same page while facilitating effective stakeholder communication to inform workforce and economic development implementation.

Implementation

EPSO

The current career pathways and regulatory environment offers several avenues for employer collaboration and involvement within the academic and vocational curriculum. “Career pathways”, broadly speaking,  is just another term for curriculum and more technically  is a hierarchy of learning experiences and programming linked to sixteen career clusters which, in part, include careers in agriculture, information technology, construction and transportation, distribution and logistics.

These available implementation avenues should be fully leveraged as they align with the standards based regulatory environment in which educators and the workforce development system must operate. The lack of common language and not leveraging standards based regulatory avenues is the reason that business-education initiatives often fall flat while instead evolving into one off events such as career fairs or Manufacturing Day. These events can be highly impactful provided they have a relevant path back into daily instructional practice for reinforcement in a sequenced career pathways curriculum and supported with parental involvement.

Transition planning provides an avenue for employer involvement into the curriculum. Transition planning is regulated and required by law to provide special needs students  a plan to transition into postsecondary life. Morgan mentioned the need for improving education and educating at-risk populations. Transition planning, in part, includes foundational skill development and career pathways planning. Transitional planning for special needs students and career planning in the standards aligned general education curriculum for all students provides an avenue for employers to collaborate in regionally relevant career pathways curriculum development while engaging and alerting students of career pathways opportunities in career/technical education, degree programming, apprenticeships and jobs. This collaborative activity and curriculum implementation helps boost postsecondary completion rates for in demand careers.

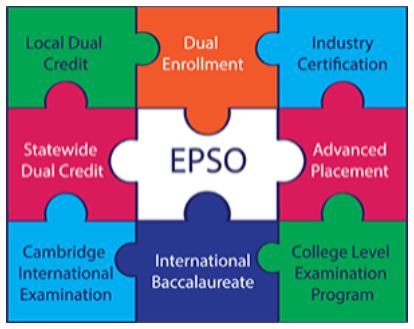
The Tennessee Department of Education’s (TDOE) Early Postsecondary Opportunities (EPSO) program offers another opportunity for employer engagement.  According to the TDOE website, “Early postsecondary opportunities (EPSOs) include a course and/or exam that give students a chance to obtain postsecondary credit while still in high school. Courses (whether stand-alone or in conjunction with an exam for postsecondary credit) must be aligned to postsecondary standards.” Further the website also states that EPSO measures are factored into district accountability measures and allow students to:

  • earn postsecondary credits while in high school.
  • become familiar with postsecondary rigor and expectations.
  • develop confidence and skills for success in postsecondary learning.
  • make informed postsecondary and career decisions.
  • decrease the time and cost of completing a certificate or degree.

EPSOs provide an avenue for employers to collaborate in curriculum development for specific in demand occupations while being aligned to educator accountability requirements. EPSO’s provide a win-win opportunity for employers and educators.

Distribution, Promotion and Measurement

With employer involvement, the deployment of a standards aligned career pathways curriculum can most cost effectively be delivered through the Internet while being supported with coaching and onsite personnel. Web technology supports the distribution of employer demand data, some assessments and standards aligned career exploration and planning modules to support student career development and employer engagement. Talent pipeline development results can be aggregated, while maintaining student privacy and displayed to the community to help drive economic development work that relies on talent pipeline development.

Social media platforms can provide further opportunity for the promotion of in demand skills, career pathways and career opportunities. All of this goes to support a paradigm shift to workforce development is economic development.

While the educational system was discussed in depth, the above programming scales to serve a variety of learning environments to include re-entry, dislocated worker, drug court, adult ed and etc.

Conclusion

Needed but squashed vitality that questions the “visionaries” on excesses has resulted in an underserved business community. Vitality is needed to fuel growth for any economy as it serves as a mechanism to course correct deficiencies. But many in Memphis, to include, the highly educated, elected officials and community at large accept these excesses as normal or  know questioning the excesses of the “visionaries” results in hardship, so it does not occur. At the same time, this missing vitality explains, in large part, why Memphis has not grown while leaving the primary drivers of any local economy in workforce and small business development behind in the dust.

As parts of the Nation struggle with a lack of diversity and an aging population, a youthful diverse population is likely the differentiating asset to drive improved economic development outcomes. Getting there will require a shift away from corporate/real estate development to workforce development as being the key driver to economic development all while benefitting the entire Memphis business community.

Other Published Workforce Development Articles

  • JustMy Memphis – Workforce: Elephant in the Room (11/5/18
  • Smart City – GMMDC: Smarter Path to Economic Development-8/15/18
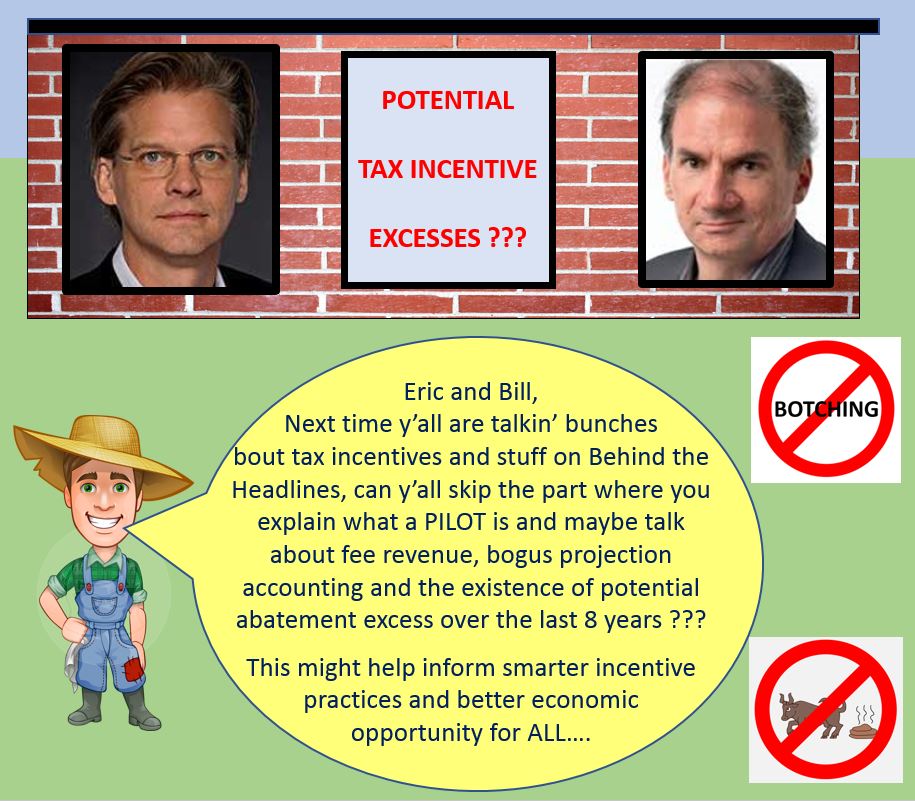
  • Smart City – Beyond PILOTs – Thinking BIG and National Leadership – 5/30/18
  • MDN – Retention PILOTs – Thinking BIG and National Leadership (4/25/18)
  • Memphis Business Journal Workforce Solution Editorial – (5/26/17)

BENCHMARKING, BETTER MEASUREMENT AND FORECASTING

May 19, 2019 Joe B. Kent Uncategorized

JNJ4

This blog follows up on a recent email exchange with a local CEO, discusses benchmarking and solutions for better measurement and tax revenue forecasting regarding PILOTs. There have been several good job PILOTs of late to include Pandrol, Power Transport, Indigo Ag, JNJ Logistics and Mimeo. Some of these wins appear to be due to the Chamber led economic development plan implementation under the leadership of Beverly Robertson and Richard Smith.

At the same time, property tax revenue growth has become a concern, which can, in part, be explained by excessive PILOT awards validated through benchmarking and an understaffed Assessor’s office. Through benchmarking, this blog identifies $150M in job PILOT excesses regarding EDGE, which is only 1 of 9 locally approved abating boards.

Additionally, in recent Commission testimony, the Assessor’s office estimated that they are 50,000+ personal property accounts short due to understaffing. Right sizing PILOT awards, informed through benchmarking and fully staffing the Assessor’s office can go a long way in supporting increased tax revenues. And, the Chamber’s implementation of a refreshing economic plan that stresses targeted industry recruitment, small business and workforce development will only help more.

Benchmarking

EricBill

As a follow up on a recent healthy email conversation with a local CEO regarding tax incentives, where the CEO made several good points, the need for incentive benchmarking arose. This benchmarking analysis vs. Nashville is designed to explain where tax incentive excesses have occurred in the past while providing a basis for right sizing future tax incentives going forward. The analysis also comes at a time where the recent Pandrol PILOT can be touted as an exemplar, as it checks the boxes of a right sized incentive, providing new well-paying jobs and developing a distressed part of the City.

First, Nashville is a boom town, so a direct comparison is not fair to most cities as a boom town can stand to pay much less for new jobs in this economic development climate. But the question is “how much more should a “non boomtown” city pay for jobs in the current economic development race?”. In this way, based on the below findings vs Nashville, the Pandrol PILOT can be used as an exemplar while the below benchmarking can serve as a basis for competitive, non-excessive and targeted tax incentive strategy while leveraging Memphis key assets of the river, rail, roads and runway.

The below table analysis is based on PILOTs conducted from 2011 when EDGE began to 2017 where the Nashville data ends. The analysis does not consider wages. The data sources used for this analysis can be found on the EDGE Website and on the Nashville.gov website. Since EDGE and Nashville documentation bundle their projects in new job and retention abatements, calculations were performed to derive individual abatement totals for both retention and new job tax abatements. See below table:

MemvsNash3

This data can help inform a public conversation around excesses to drive incentive reform while also helping inform the weekly show Behind The Headlines frequent tax incentive conversation. Behind the Headlines often touts how often they discuss tax incentives, while saying “all cities offer incentives” and not taking up a conversation of potential excesses in the Memphis system. Talking regularly about incentives while not taking up potential excesses in the system is just unhelpful to the public conversation.

From the table above, which excludes residential PILOTs (another concern), the following conclusions can be drawn for abatements made between 2011 and 2017 in Memphis and  Nashville:

  • Memphis awarded $363M and Nashville $162M in job tax incentives
  • Memphis incentives supported 11,035 retained and 4,699 new jobs
  • Nashville incentives more outbound approach supported 8,989 retained jobs and 12,641 new jobs
  • Memphis paid $21,354 per retained job or 357% more than Nashville at $4,675
  • Memphis paid $27,137 for new jobs or 186% more than Nashville at $9,503

So, through benchmarking, let’s do some figurin’ here to see if we can arrive at an overall excess abatement amount while generously considering all of the variables. Let’s allocate 25% increased abatement for non boomtown status  (like most cities) for Memphis/Shelby and an additional 100% increased abatement amount for a high property tax rate which ignores the Memphis/Shelby benefit of much lower property costs. In this way the recent Pandrol PILOT can in effect be used as a standard as it is 121% greater than the Nashville average while paying a good wage of $50K per year.

  • Using the table above for existing retained jobs and Nashville as a basis along with the recent Pandrol PILOT, we will abate $4675 x 1.25 = $5,844 ; $4,675 + $5844 = $10,519  for each retained job. Memphis retained jobs of 11,035 x $10,519 = $116,077,165. Now we take the actual abatement for retained jobs of $235,643,285 – $116,077,165 = $119,566,120 in excess abatement for existing retained jobs. We are back to the $100M excess figure that this blog and the Beacon Center of Tennessee wrote about on retention PILOTs. 
  • For new jobs, we take $9,503 x 1.25 = $11,879 ; $9503 +  $11,879 = $21,382 for each new job. Memphis new jobs of 4,699 x $21,382 = $100,474,018. Now we take the actual abatement of $127,516,992 – $100,474,018 = $27,042,974 in excess abatement for new jobs.
  • Total excess abatement $119,566,120 (existing retained jobs) + $27,042,974 (new jobs) = $146,609,904 in excessive approved abatements

The above findings point to significant excesses thereby contributing an estimated $146M to Memphis/Shelby property tax revenue shortfalls or $15M per year.

All of this to say,  this benchmarking validates concern over tax incentive excesses when benchmarked against Nashville while hopefully knowing that benchmarking, the implementation of a new economic development plan and better measurement can help inform more fiscally conservative results and better outcomes for the community.

Better Measurement and Forecasting

Since they are one of the financial sponsors, it seems that Shelby County Government should own economic modeling for incentives to facilitate more accurate measurement and forecasting for property tax revenues while serving as an involved public check on the economic development complex. After all, local government funds the fee revenue to EDGE that incents abatement awards, funds the tax abatement through decreased taxes and now helps staff the place. It seems local government would, at least, want to participate in accurately accounting for and measuring some of this stuff. The economic modeling and accounting function would fit well into the Shelby County Regional Economic Development Alliance work.

In this way, both better measurement and tax revenue forecasting could be accomplished for the overall good while supporting a fully staffed Assessor’s office. Excessive abatements and underassessed property are not good for anyone to include the overall business community. As an elected official, the Assessor could fully account for retention and new job PILOTs which under EDGE has resulted in incomplete accounting that has led to justifying excessive tax abatements. Excessive abatements contribute to property tax revenue shortfalls and incomplete accounting fails to contribute to effective property tax revenue forecasting and economic development measurement regarding tax incentives.

While this blog has ranted about excessive retention PILOTs justified with bogus accounting, EDGE’s expansion PILOT accounting is incomplete. For example, while the Pandrol expansion PILOT remains an exemplar, the projection accounting does not consider that many of those that will be getting jobs are already part of the tax base. After all, the people that will take these jobs are  mostly existing residents that locally live somewhere and pay sales taxes to eat and clothe themselves. And the modeling MAY not include subtracting out the existing taxes being paid on the location at 611 Winchester of $16,576 per year.

With that stated, NOT using economic multipliers, can in effect, take into account the existing tax base that will fill jobs. And, accounting for existing taxes being paid on the property can result in a more accurate total tax revenue generated number to inform better economic measurement and tax revenue forecasting.

To that extent, without concern for the right sized abatement award and fully accounting for the above-mentioned variables, the projected revenue for Pandrol can be reduced down from $5M to $2.5M while still benefitting taxpayers and considering a responsible $1.5M abatement amount. In this way, more accurate economic development measurement and more fiscally conservative tax revenue forecasting occurs.

Conclusion

All of the work by the Chamber, the Shelby County Regional Economic Development Alliance and the Assessor’s office seems to be headed in the right direction. Defined economic development measurement seems to be outstanding. Perhaps local legislative bodies can help the Shelby County Regional Economic Development Alliance with measurement and definition.

Linking up better measurement and definition through the Shelby County Regional Economic Development Alliance will insure better measurement, tax revenue forecasting and economic opportunity for all.


PROPERTY TAX REVENUE – WHAT HAPPENED ?

May 17, 2019 Joe B. Kent Uncategorized

PropTaxWhat

This blog is about using data and quantitative analysis to solve community evolutionary challenges to serve local business and the Memphis community overall with a special focus of lagging property tax revenue growth. Significantly lagging property tax growth and high levels of poverty negatively impact corporations and the entire community.

Having lived and researched the problem, I understand part of what ails the community in lagging small business vitality as I have been driven into poverty by the closed Crump culture Memphis Royalty establishment. For example, I have had business solutions on the table as a locally owned small business for 3 years for connecting struggling workforce development efforts. Recently, I was cited in the Commercial Appeal on the matter while having been published across the local media spectrum on the matter for 3 years.

At the same time, the good news is that the Greater Memphis Chamber is responding under the new leadership of Beverly Robertson. Following the CA article, the most recent Momentum publication indicates that steps are finally being taken to obtain needed employer demand data to inform the workforce development system after 3 years. And additionally, the Chamber also has set an increased $100M locally owned small business spend goal to support economic development efforts, while the Epicenter provides needed guidance in he publication to support needed cultural transformation away from the closed Crump system of the 1940s.

But this blog is about lagging property tax revenue growth. Memphis often measures itself against itself as opposed to more external measurement targets which has helped enable a good part of the decline while being further sheltered by a non-investigative press.  To that extent the above graph benchmarks Shelby County property tax growth against that of the nation. Property tax revenue represents 64% of Shelby County revenue.

As contained in the spreadsheet, when benchmarked against national property tax revenue growth rates, $1B in deficient community investments can be accounted for since 2008, with $185M in annually recurring deficient revenue scheduled to occur. So how might we account for the $185M recurring annual shortfall ? Its for sure not 1 thing. So lets give it a shot.

Accounting for Deficient Property Tax Growth

Slow Growth $40M Tax Revenue Shortfall – Good news is the Chamber and Epicenter are addressing this now. The bulk of this is rooted in culture and can be found in lagging small business vitality and disconnected workforce development efforts. The remainder is rooted in deficient economic development planning and execution to support business recruitment. This is also being addressed. Slow economic growth accounts for an estimated $40M of the $185M and can be validated with 3rd party data.

Assessor’s Office $20M tax revenue shortfall– The  Shelby County Assessor has been neglected for years. While an immediate increase in funding for the Assessor’s office, the office can increase property tax revenue from $4-7M for 2020. It is estimated that the recurring tax revenue shortfall due to a neglected Assessor’s office has grown, over time,  to approximately $20M of the $185M revenue shortfall. The $20M estimate was based on listening to Assessor Office budget Commission testimony on Wednesday.

Excessive PILOTs $15M – It is estimated that $15M of the $40M in PILOTs are excessive which includes the large amount of retention PILOTs as well as other PILOTs that use a deficient projection accounting methodology. Bringing economic modeling for tax abatement in house to Shelby County Government to perhaps reside with the Assessor to inform better projection accounting overall and measurement specifically with regard to PILOTs would seem to be a logical step. It doesn’t make sense to outsource projection accounting for PILOTS to agencies that are incented through fee revenue to abate taxes. This lack of financial control doesn’t make sense and doesn’t measure up against any business or fiscal conservatism standards.  And, for the record, not all PILOTs are bad. Just this week the Pandrol PILOT award is an example of an excellent PILOT, in the current environment, while being aligned to target economic development sectors, bringing in NEW well paying jobs and being located in a distressed part of the City.

Tax Rate ??? shortfall – There is no way that less than optimal tax rates can represent the remaining $110M in deficient property tax revenue but a less than optimal tax rate certainly must be a contributor. Again, there is not just one contributor. Chairman Van Turner termed the tax rate hike discussion as “blasphemy” but bravely laid it on the table.

Conclusion

So there you have it. Slow economic growth, a neglected Assessor’s office, excessive PILOTs and less than optimal tax rates. Its not just one thing……

Please let me know if you have questions about the data or a differing data source that would add clarity to the matter. I can be reached at jkent@pathtrek.net

References

http://www.shelbycountytn.gov/163/Budget-Documents

https://www.census.gov/econ/currentdata/dbsearch?program=QTAX&startYear=2008&endYear=2019&categories=QTAXCAT1&dataType=T014QE&geoLevel=US&notAdjusted=1&submit=GET+DATA&releaseScheduleId=#line

https://www.census.gov/econ/currentdata/dbsearch?program=QTAX&startYear=2008&endYear=2019&categories=QTAXCAT1&dataType=T094QE&geoLevel=US&notAdjusted=1&submit=GET+DATA&releaseScheduleId=#line

LAGGING PROPERTY TAX REVENUE

May 10, 2019 Joe B. Kent Uncategorized

PropTax08-20

This blog is designed to support data driven problem solving through quantitative analysis. This is as opposed to governing through positive talking points. So, I will leave this with the County Commission as I will personally miss all of you and will not be at the meeting on Monday. And please, if you would, if anyone has questions about the data or sees a mistake in the data, please let me know. I may have done something wrong. Its about the data driven quantitative conversation beyond positive talking points and not about being perfectly right for me.

At the same time, I must say, that I am surprised, given local needs, at the lack of advocacy, beyond just me, for a meaningful property tax increase. That advocacy should be somewhere in the system and its not which goes to one of my concerns of lacking vitality to fuel growth from those type of left of center advocacy organizations that would typically push for a property tax increase. It seems left of center organizations in Memphis are tapped down for some reason on many real economic development matters. Don’t know why???

Anyway, the below data begins to make the case for an increase in the property tax rate. Representing 10% of the budget, Shelby County sales tax growth  has kept pace with the rest of the country  but property tax revenue growth has not while representing 60%+ of  County revenues. There is not just one reason for this. It appears to be a number of reasons to include: 1) below average economic growth 2) Low less than optimal tax rates 3) low property values and 4) tax abatements not coming down.

The good news is that there are steps being taken to improve economic growth through a Greater Memphis Chamber new economic development plan and advocacy from the Assessor’s office to increase staffing, which is well below State requirements, to support improved commercial appraising efforts. But there are no conversations for a tax increase which is also part of the problem.

The below graphs, may help the business community see the value to them in increasing the property tax rate to support decreasing poverty while better supporting the societal foundation on which commerce thrives. Raising property tax rates is a business solution to a business problem as supported by data.

The first graph compares Shelby County property tax growth with the rest of the country. Had Shelby County property tax rates achieved national growth rates, annual County property tax revenue would be $145M higher. See graph below and spreadsheet here and please bring concerns of the data to my attention as this blog is trying to drive an informed and accurate data driven conversation beyond positive talking points. PropTax08-20

Next, is a graph of Shelby County gross receipts and sales tax revenue growth rates over the same period. As you can see, Shelby County gross receipts revenue has exceeded the growth rate of the rest of the country.

Sales Tax

And finally, this is a graph of cumulative property tax growth from 2003-20 of Shelby County vs the nation. Had Shelby County achieved national trend line property tax growth since 2003, annual recurring property tax revenue would be $100M higher.

PropGrowth03-20

Conclusion

A strong data driven business case can be made for confronting lagging property tax revenue on a variety of fronts to include 1) increasing property tax rates 2) fully staffing the Assessors office per State requirements and 3) decreasing tax abatements.

Again, please email me questions or concerns about the data as I would like to get this right so that we can have an informed, accurate and data driven conversation to support local tax policy. My email is jkent@pathtrek.net

References 

http://www.shelbycountytn.gov/163/Budget-Documents

https://www.census.gov/econ/currentdata/dbsearch?program=QTAX&startYear=2008&endYear=2019&categories=QTAXCAT1&dataType=T014QE&geoLevel=US&notAdjusted=1&submit=GET+DATA&releaseScheduleId=#line

https://www.census.gov/econ/currentdata/dbsearch?program=QTAX&startYear=2008&endYear=2019&categories=QTAXCAT1&dataType=T094QE&geoLevel=US&notAdjusted=1&submit=GET+DATA&releaseScheduleId=#line

ADEQUATE TRANSIT & PROPERTY TAX INCREASE ANALYSIS

May 6, 2019 Joe B. Kent Uncategorized

The following analysis is designed to provide a more accurate analysis of the impact Memphis/Shelby property tax rates when considering a variety of cost variables in comparison with other geographic regions. The reason for this analysis is to better understand the potential impact of increasing property taxes to raise tax revenue through a 5% City / County property tax increase in order to reduce poverty and improve overall quality of life primarily through funding and providing adequate public transit services. Studies have shown that a $30M investment in transit will generate $120M in economic returns.

A 5% Memphis/Shelby property tax increase is projected in this model to produce $40M in additional tax revenue based on $1B in total property tax revenue. A 20% reduction in tax revenue is built into the modeling to provide price elasticity for lost tax revenue due to increased property tax rates.

The first table compares Memphis/Shelby County total housing cost versus Nashville and the Nation. A $7.61 total Memphis tax rate is used and a $6.20 Shelby County rate is used to accommodate for higher property values outside of Memphis and additional municipal taxes.

proptaxincrease2

Next, the table below provides a regional analysis in comparison with bordering Fayette and Desoto counties with lower property tax rates. The modeling is designed to show the impact of increased transportation costs for more mobile populations that choose to depart Memphis/Shelby due to a property tax increase of 5%. Download the following spreadsheet to change the color coded modeling assumptions for your personal use. Below are the results that show the net cost impact when considering increased transportation costs and relocating due to a 5% increase in Memphis/Shelby property taxes.

PropTransReg2

TAX INCREASE

May 2, 2019 Joe B. Kent Uncategorized

taxincrease

An old fashioned tax increase might be just the right response to Corporate Socialism that has dominated the local policy landscape for years. With some $800M  in approved tax abatements, a 4% City / County property tax increase would raise approximately $40M in property tax revenue to address tax revenue shortfalls that have been further irritated by below peer average total wage growth.

Such new revenue would fill part of the gap to fund true economic development efforts in such areas as transit and workforce development. A 4% tax increase would cost Shelby County homeowners, on average, less than $70 per year and could bridge the funding gap as more comprehensive economic and workforce development implementation occurs under the leadership of Beverly Robertson and the Greater Memphis Chamber.

This proposal comes after studies completed two years ago identified inadequate funding as the chief obstacle to adequate transit service provided by the Memphis Area Transit Authority (MATA). Local studies found that a $30M investment in transit can generate $120M in  economic returns while addressing poverty through increased disposable income from household transportation savings.

While numerous funding solutions have been discussed none have been formally proposed to close the funding gap. This results, as those resistant to property tax increases, accurately state Memphis/Shelby property tax rates are high. But given low property values in Memphis/Shelby, higher property tax rates don’t tell the complete story. Given this reality, the below table shows 4% increased Memphis/Shelby tax rates and total annual home ownership costs for various locations assuming a 4.5% 30-year mortgage. A $6.16 blended property rate is used for Shelby County outside of Memphis to accommodate for higher residential property values, municipal taxes and unincorporated Shelby County.

proptaxincrease

Corporate Socialism

This blog believes socialism and particularly corporate socialism is Un-American. Fake fiscal conservatism has been used as the basis for decreasing taxes for years as spending levels continue to rise while corporate interests thrive. One of the greatest examples for corporate socialism nationally is in private healthcare where Americans pay 2.5x the world average for effectively the same outcomes. To give this some context, the excess costs are the equivalent of a new car for every man, woman and child or a home for a family of 4 in the United States.

In Memphis, corporate socialism has taken hold with 9 abating tax boards and excessive retention PILOT policy that has been shown to cost taxpayers over $100M while being reported as a $700M gain by the EDGE Board. All of which occurs as small business vitality plummets and below peer average wage growth occurs while corporate/real estate interests thrive.

But there is good news. The Memphis activist community is responding with such true rock star leaders  as Earle Fisher (People’s Convention), Pearl Walker (MRYE), Britney Thornton (MICAH) and Charles Belenky (May Day). These individuals are speaking out for the people and in many cases against corporate socialism.

Incentive Reform

While there is also good news on the economic development front with an exciting plan announced by the  Greater Memphis Chamber in a targeted industry recruitment plan while also emphasizing small business and workforce development that leverages local assets in the river, rail, runway and roads, tax incentive reform is needed. To that extent, the following incentive reform recommendations are made:

  1. New EDGE Board
  2. End retention and residential PILOTs
  3. Shelby County Assessor formal analysis of all tax incentives
  4. Abatement board fee alignment that incents Memphis/Shelby taxpayer representation
  5. Shelby County Commission evaluation of all 9 abating boards.
  6. Advocacy for Federal and State legislation to prohibit the use of tax incentives for recruiting company relocations within 200 miles in order to support regional economic development efforts

When the above recommendations are coupled with better economic and workforce development implementation, Memphis quality of life can only improve for  All.

Conclusion

A tax increase and incentive reform can help bridge the gap to improved economic development outcomes while providing Memphis/Shelby citizens with mission critical services that support local economic development and poverty reduction. Memphis is alive with an exciting economic development plan, a more informed activist community and hopefully more rigorous legislative oversight. These forces, working for a better Memphis, provide the city with the needed vitality to correct local imbalances and thrive well into the future.

References

https://www.zillow.com/nashville-tn/home-values/

https://www.zillow.com/shelby-county-tn/home-values/

https://www.zillow.com/memphis-tn/home-values/

https://www.zillow.com/home-values/

Pages

  • ABOUT
  • Attribution
  • CONTACT
  • CRISIS IN SYSTEM CONFIDENCE
  • DAILY MEMPHIAN: Actively Censoring Free Speech
  • DATA: For Shelby County Macroeconomic Analysis
  • DEFICIENT ECONOMIC DEVELOPMENT – TAXPAYER LOSS
  • Economic Development Growth Engine (EDGE)
    • EDGE Public Comment – 06/20/18
  • EDGE Retention PILOT Program (A Memphis Tomorrow Bi-Product)
    • Existing and Additional Facility Capital Investment (3)
    • Existing Facility Retention PILOT Capital Investment (7)
    • Local Facility Relocation (3)
    • New and Existing Facility Capital Investment (1)
    • New Facility and Consolidation from West Memphis (2)
    • New Facility Capital Investment (2)
  • Educational Attainment Requirements by Geography
  • Greater Memphis Alliance for Competitive Workforce (GMACW)
  • Implement
  • IT’S WEIRD
  • Median Age vs Memphis Peers
  • Memphis Chamber of Commerce
  • Memphis Raise Your Expectations (MRYE) Economic Development #BalanceMemphis
  • Memphis Tomorrow Executive Committee – $124M in taxpayer shortfalls
  • MRYE Memphis Economic Development Survey
  • MWBE DASHBOARD
  • PUBLIC PARKING PORN
  • RESOURCES
    • Memphis City Council Attempted Comment Not Heard – 06/19/18
  • SOLUTION
  • What Does $124M Look Like in Community Benefit ?
  • WORKFORCE: Lost Decade

Archives

  • April 2022
  • February 2022
  • January 2022
  • December 2021
  • November 2021
  • October 2021
  • September 2021
  • August 2021
  • July 2021
  • June 2021
  • May 2021
  • April 2021
  • March 2021
  • February 2021
  • January 2021
  • December 2020
  • November 2020
  • October 2020
  • September 2020
  • August 2020
  • July 2020
  • June 2020
  • May 2020
  • April 2020
  • March 2020
  • February 2020
  • January 2020
  • December 2019
  • November 2019
  • October 2019
  • September 2019
  • August 2019
  • July 2019
  • June 2019
  • May 2019
  • April 2019
  • March 2019
  • February 2019
  • January 2019
  • December 2018
  • November 2018
  • October 2018
  • September 2018
  • August 2018
  • July 2018
  • June 2018

Categories

  • Chamber Alliance (1)
  • City Council (4)
  • County Commission (3)
  • Economic Development (1)
  • EDGE (2)
  • Memphis Tomorrow (2)
  • Public Comment (7)
  • Strip (1)
  • Uncategorized (269)

WordPress

  • Log in
  • WordPress

Subscribe

  • Entries (RSS)
  • Comments (RSS)

Pages

  • ABOUT
  • Attribution
  • CONTACT
  • CRISIS IN SYSTEM CONFIDENCE
  • DAILY MEMPHIAN: Actively Censoring Free Speech
  • DATA: For Shelby County Macroeconomic Analysis
  • DEFICIENT ECONOMIC DEVELOPMENT – TAXPAYER LOSS
  • Economic Development Growth Engine (EDGE)
    • EDGE Public Comment – 06/20/18
  • EDGE Retention PILOT Program (A Memphis Tomorrow Bi-Product)
    • Existing and Additional Facility Capital Investment (3)
    • Existing Facility Retention PILOT Capital Investment (7)
    • Local Facility Relocation (3)
    • New and Existing Facility Capital Investment (1)
    • New Facility and Consolidation from West Memphis (2)
    • New Facility Capital Investment (2)
  • Educational Attainment Requirements by Geography
  • Greater Memphis Alliance for Competitive Workforce (GMACW)
  • Implement
  • IT’S WEIRD
  • Median Age vs Memphis Peers
  • Memphis Chamber of Commerce
  • Memphis Raise Your Expectations (MRYE) Economic Development #BalanceMemphis
  • Memphis Tomorrow Executive Committee – $124M in taxpayer shortfalls
  • MRYE Memphis Economic Development Survey
  • MWBE DASHBOARD
  • PUBLIC PARKING PORN
  • RESOURCES
    • Memphis City Council Attempted Comment Not Heard – 06/19/18
  • SOLUTION
  • What Does $124M Look Like in Community Benefit ?
  • WORKFORCE: Lost Decade

Archives

  • April 2022
  • February 2022
  • January 2022
  • December 2021
  • November 2021
  • October 2021
  • September 2021
  • August 2021
  • July 2021
  • June 2021
  • May 2021
  • April 2021
  • March 2021
  • February 2021
  • January 2021
  • December 2020
  • November 2020
  • October 2020
  • September 2020
  • August 2020
  • July 2020
  • June 2020
  • May 2020
  • April 2020
  • March 2020
  • February 2020
  • January 2020
  • December 2019
  • November 2019
  • October 2019
  • September 2019
  • August 2019
  • July 2019
  • June 2019
  • May 2019
  • April 2019
  • March 2019
  • February 2019
  • January 2019
  • December 2018
  • November 2018
  • October 2018
  • September 2018
  • August 2018
  • July 2018
  • June 2018

Categories

  • Chamber Alliance (1)
  • City Council (4)
  • County Commission (3)
  • Economic Development (1)
  • EDGE (2)
  • Memphis Tomorrow (2)
  • Public Comment (7)
  • Strip (1)
  • Uncategorized (269)

WordPress

  • Log in
  • WordPress

CyberChimps WordPress Themes

© MCCL