
DEFICIENT ECONOMIC DEVELOPMENT – TAXPAYER LOSS
This page summarizes the deficient economic development results of the Memphis Corporate Community Leadership Complex using summary explanations with corresponding graphical information and third party data sources. Deficient economic development efforts and excessive EDGE retention PILOT tax abatements are estimated to cost Memphis/Shelby County taxpayers $65-70M per year. Additional taxpayer losses can be found on this page regarding disconnected workforce development costing taxpayers an additional $15M per year resulting in an estimated total taxpayer shortfall of $85M from deficient economic and workforce development efforts.
DEFICIENT BELOW AVERAGE TOTAL WAGE GROWTH
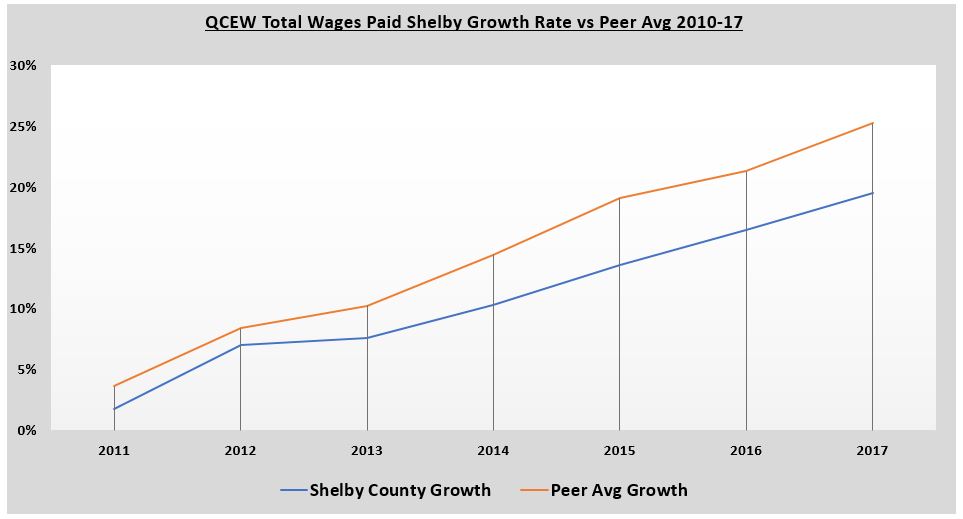
The below graph, derived from this spreadsheet quantitatively validates the work contained the graph. The data was sourced from the Bureau of Labor and Statistics Quarterly Census of Employment Wages (QCEW) program. The graph shows total annual wages paid per year in Shelby County versus Shelby County’s peers as identified by The Memphis Economy of the University of Memphis.
Shelby County total wages paid growth rate trails the average of its peers by approximately 7% with 21.15% total wage growth since 2010-17. Shelby County peers had an average growth rate of 28.18%. Had Shelby County had average growth of 28.18% total wages paid would have been $1.57B higher annually in Shelby County with Memphis and Shelby County tax revenue being approximately $47M higher on a recurring annual basis than it is today. The tax shortfall is derived by using calculations informed by EDGE. The graph below shows the gap between Shelby County’s total wage growth rate and the average of its peers accelerating.
SMALL BUSINESS VITALITY
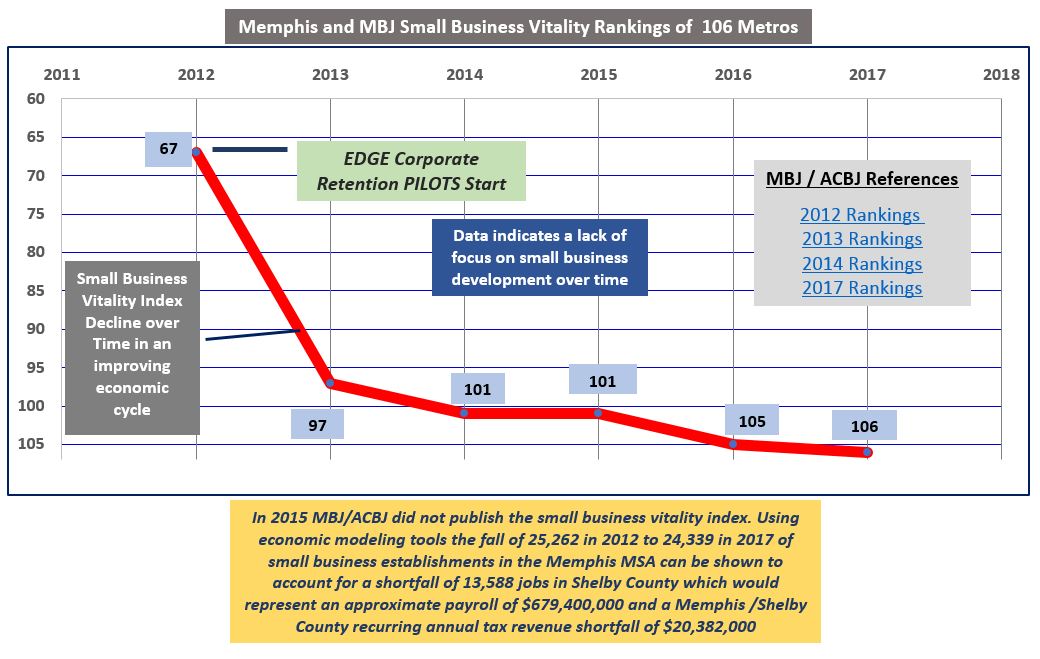
The below graph shows declining Memphis small business vitality when compared to 106 metros during an improving economic cycle. The source of this data is the American Cities Business Journal (ACBJ) parent to the Memphis Business Journal (MBJ). A small business vitality index was not published in 2015 so the 101 ranking of 2014 was assumed. This trend line graph is concerning because typically local economic growth comes mostly from small business. Local small business is less likely to demand tax incentives while further diversifying the local economy. In this Good Jobs First – Small Business study, small business believes excessive incentive programs strain the tax base and compromise community wide services that support small business growth. The following ACBJ links provide the data sources for the below graph with the 2016 rankings contained in the 2017 rankings link: 2012 Rankings 2013 Rankings 2014 Rankings 2017 Rankings.
BOGUS EDGE ACCOUNTING / TAX LOSSES
The following is a video that models EDGE accounting for problematic retention PILOTs versus more healthy and needed new job expansion PILOTs for economic development. A new more professionally balanced EDGE Board is needed based on the fact that the EDGE Board used bogus accounting to justify excessive tax abatements for existing companies resulting in a $250M+ tax loss and an $850M overstatement of projected revenue. Excessive tax abatements undermine economic growth and only benefit the small few as elitist feed off a community in need.
In effect, after fully accounting for retention PILOTs through modeling using responsible assumptions, one can just revert back to common sense to know that abating taxes against the existing tax base is a direct tax loss. To see complete calculations with responsible assumptions disclosed, go to this MCCLM page. See video below: