Real measurement is blaspheme to the Memphis economic development complex. Throughout history, hack visionaries have used bogus measurement platforms, pageantry and other forms of idolatry to distract from reality in order to maintain the status quo. Memphis is no different.
To that extent, MCCL Measured is about supporting real measurement, within a quantitative context, translated into a taxpayer dollar common language everyone can understand. The recent release of the Bureau of Labor and Statistics (BLS) Quarterly Census of Employment Wages (QCEW) of 2018 data provides an opportunity for real measurement and away from unreliable devices like the EDGE Scorecard. A comprehensive set of tables, graphs and rankings can be found in the below following sections.
The below analysis provides elected officials with an opportunity to understand return on investment for $500M in job tax incentives which have been shown to be $150-200M in excess. This excess is based on a previous benchmarking analysis conducted by MCCL Measured while also identifying EDGE’s application of incomplete bogus projection accounting to justify excessive corporate/real estate tax abatements.
At the same time, a completed economic development plan or defined measurement methodology has yet to be released after 1.5 years. MCCL Measured and MRYE have proposed specific research based proposals for economic development measurement, PILOT reform and workforce development on the record over the last year. But those proposals have been systematically dismissed by local legislators within a closed economic development system.
The below analysis adopts “improving the social well being of people through increased total wages” as a measurable economic development definition. Total wages in a region increase as a result of increased employment and wages. Return on investment is measured based on measuring total wages, employment and average wage growth against the growth average of 15 Shelby County peers as established by The Memphis Economy of the University of Memphis.
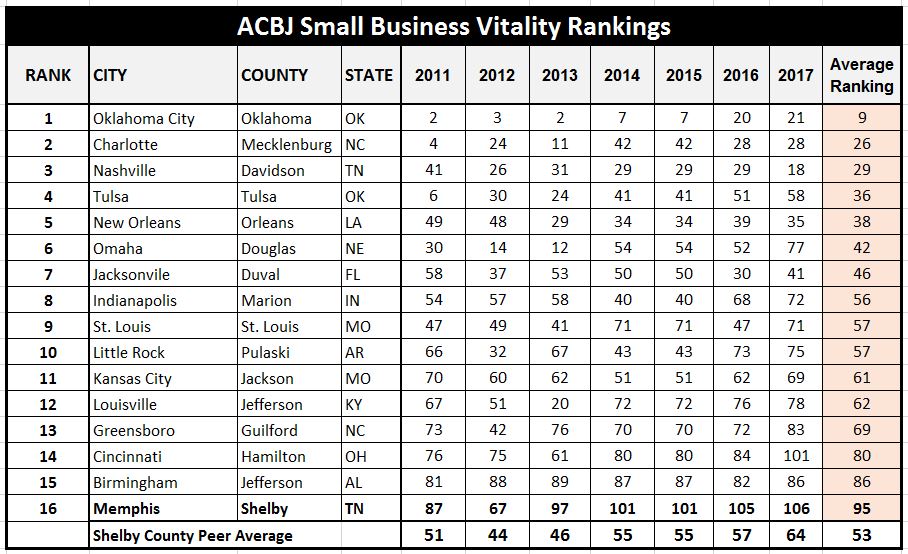
Additionally, the most recent small business vitality rankings of the American Cities Business Journal are summarized for review. The overall findings of this blog suggest that lagging small business and employment growth brought on by disconnected workforce development efforts are the primary drivers of deficient total wage growth. Using a common language of tax dollars, the below analysis quantifies deficient tax revenue at $250M since EDGE began and annually recurring at a $51M shortfall. Combine $250M with $200M in excessive abatements and a $450M Memphis/Shelby tax revenue shortfall has accumulated since 2010 while annually recurring at $71M. And then there is the disassembled Assessor’s office but that is another blog story.
And finally, using BLS QCEW data with tables and graphs, the below analysis quantifies accumulated taxpayer shortfalls due to below average total wage, employment and average wage growth. A bright spot can be found in the below data with Shelby County eclipsing the employment peer average growth rate for 2018. The analysis spreadsheet is available for review and please forward any questions to me at jkent@pathtrek.net
Total Wage Growth
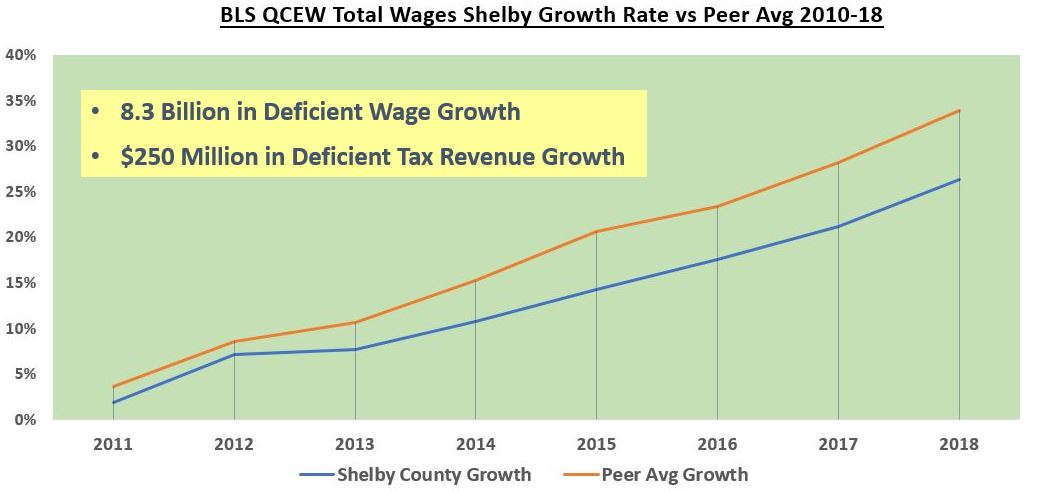
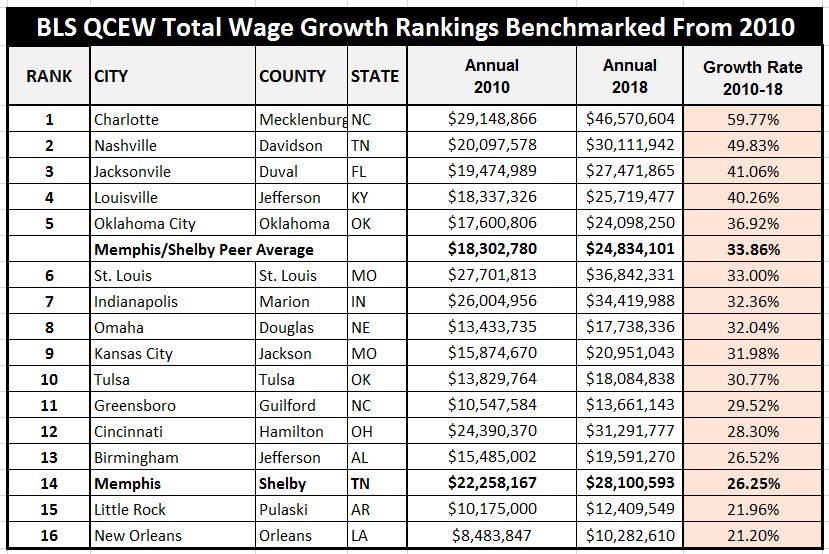
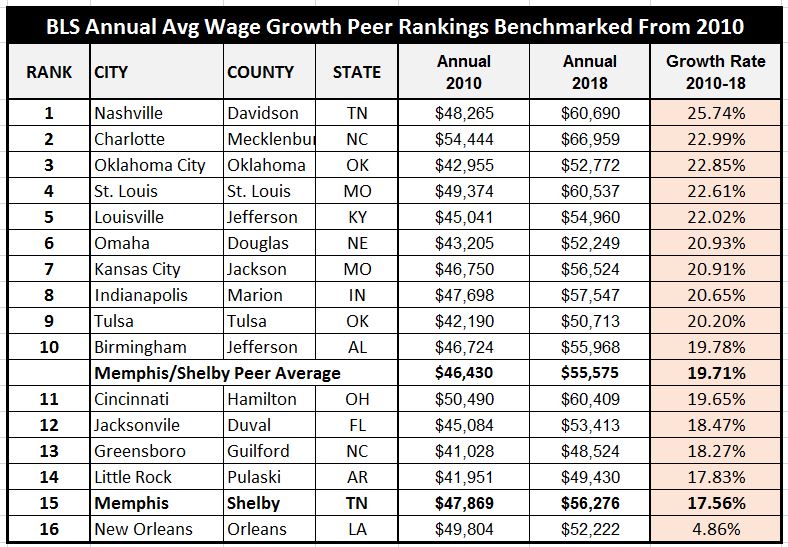
The below data reveals $8.3 billion in deficient accumulated Memphis/Shelby wage growth and $250M in tax revenue shortfalls since 2010 versus the peer average. One anomaly showed up within the data with New Orleans having far below the peer average for average wage growth of 4.9% while having above average employment growth and small business vitality. This points to potential unreported wages tied to tips based on a highly concentrated New Orleans hospitality industry. Unreported wages would have a depressing effect on New Orleans total and average wage growth and the anomaly shows up in the next to last Average Wage Growth section of this blog.
See below tables, graphs and rankings:
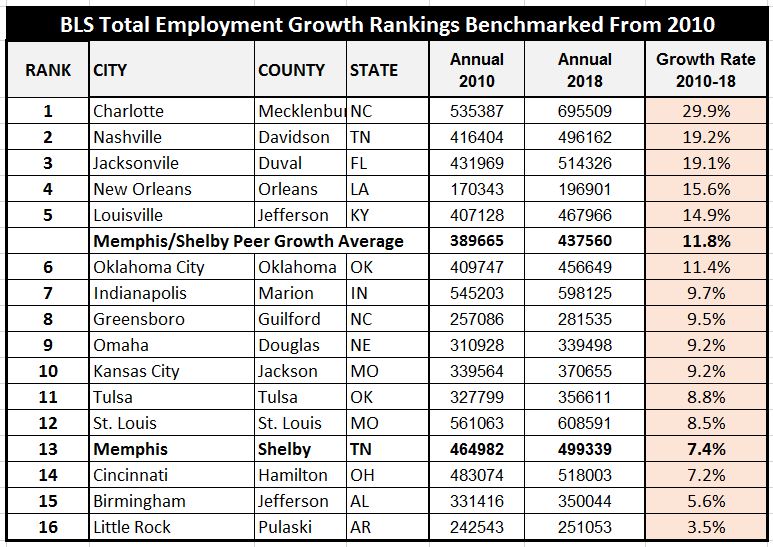
Employment Growth Data
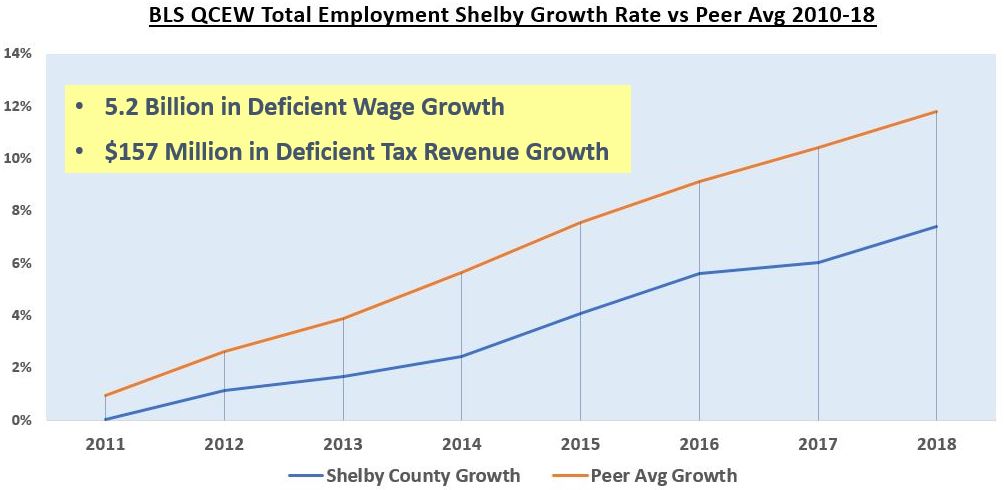
The below data shows $5.2 billion of the $8.3 billion in deficient Memphis/Shelby wage production and $157M of the $250M accumulated tax revenue shortfalls due to lagging employment growth. See below graphs, tables and rankings:
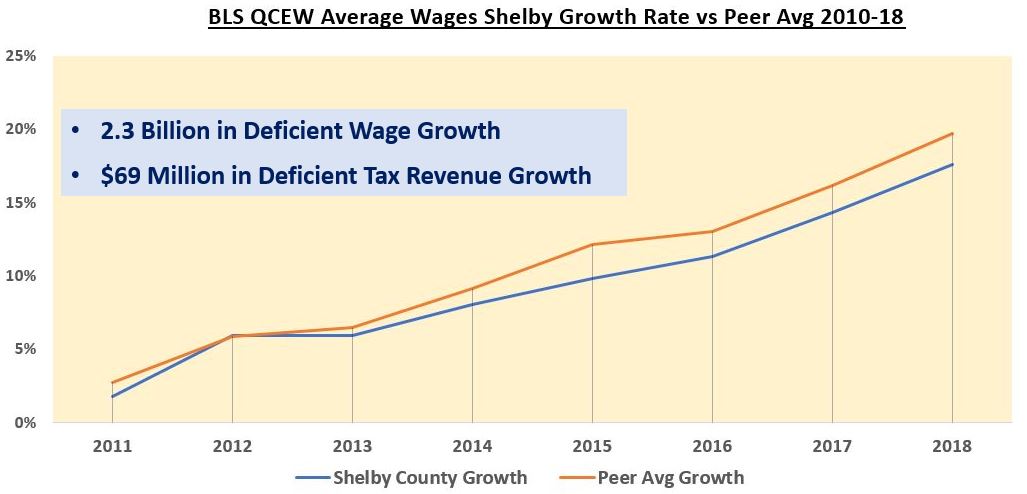
Average Wage Growth
The below data shows $2.3 billion of the $8.3 billion in accumulated deficient Memphis/Shelby wage growth and $69M of the $250M tax revenue shortfall is due to deficient average wage growth. The remaining amounts to balance the employment and average wage shortfalls with total wage shortfalls would be found in the the combined marginal difference of employment and average wage shortfalls multiplied and added together which can be done but is not part of this analysis. Additionally, this is where the New Orleans data anomaly reveals itself. See below graphs, tables and rankings:
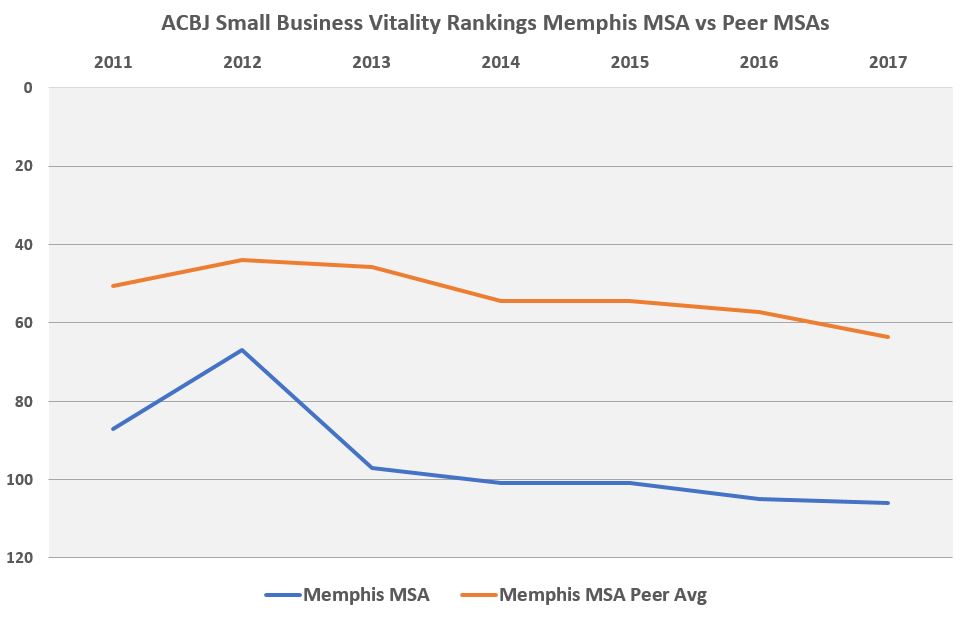
Small Business Vitality – 106 Metros
The below summaries the findings of the ACBJ Small Business Vitality Index of 106 metros with Memphis/Shelby 15 peers extracted. See below graphs and rankings.
Conclusion
A departure from bogus measurement and idolatry is needed to improve economic and workforce development efforts. The implementation of a completed economic plan, PILOT reform and real measurement that reconnects leadership with reality is the only path forward to improving quality of life and evolving the Memphis ecosystem in order to attract economic investment.

