Memphis Corporate Community Leadership Measured

  • ABOUT
  • MWBE
  • SOLUTION
  • IT’S WEIRD
  • RESOURCES
  • CONTACT
  • MRYE

DATA POINTS

September 11, 2019 Joe B. Kent Uncategorized

The below data sets reveal excessive incentives in context with low employment growth since 2010. Excessive incentives along with unfilled jobs result in deficient tax revenues and the lack of funding for adequate transit, education and etc. Fully calculating the impact of excessive incentives combined with below average total wage growth result in $300M in deficient community investments since 2010 and $75M in recurring annual tax revenue shortfalls. $75M per year would provide adequate transit and $45M more for other needed services.

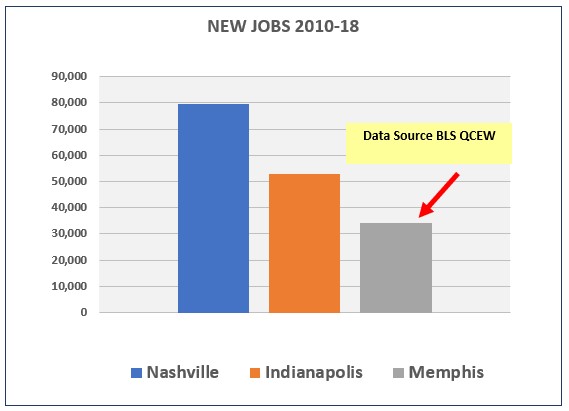
Slow employment growth. Data source Bureau of Labor Statistics Quarterly Census of Employment Wages (BLS QCEW)

NewJobs2

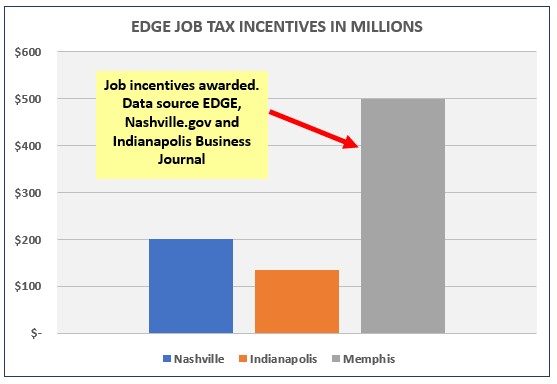
With slower employment growth, one would expect lower overall incentives vs cities with more growth. Not the case. Memphis has 50% more in job incentives at $500M+ than both Nashville and Indianapolis combined at $335M.

NewJobsIncentives2

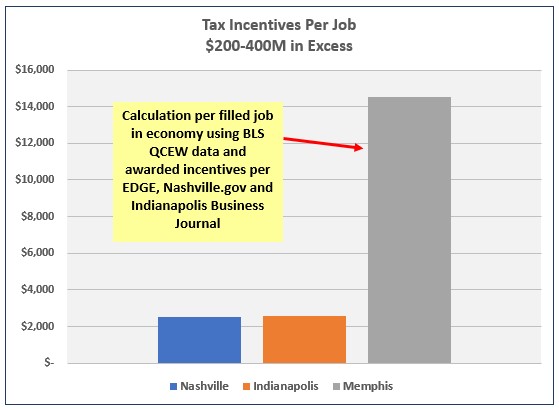
Fewer filled jobs divided by larger incentive amounts results in high per employed job incentive amounts. Indianapolis and Nashville at $2.5k and Memphis at $14.5k. Data sources BLS QCEW, EDGE, Nashville.gov and Indianapolis Business Journal. A strict analysis here, would reveal a $400M+ excess.

Newperjob2

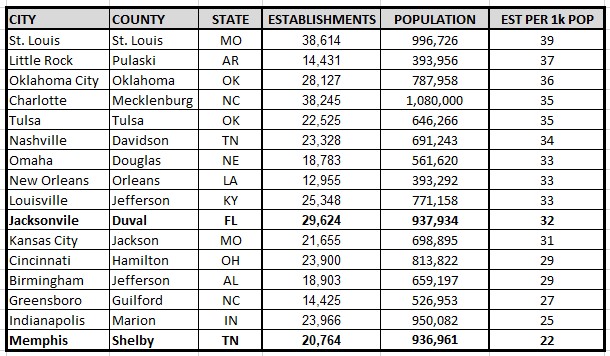
This table reveals a lack of small business establishments. Business establishments per 1k population. Data source BLS QCEW. 

EST2

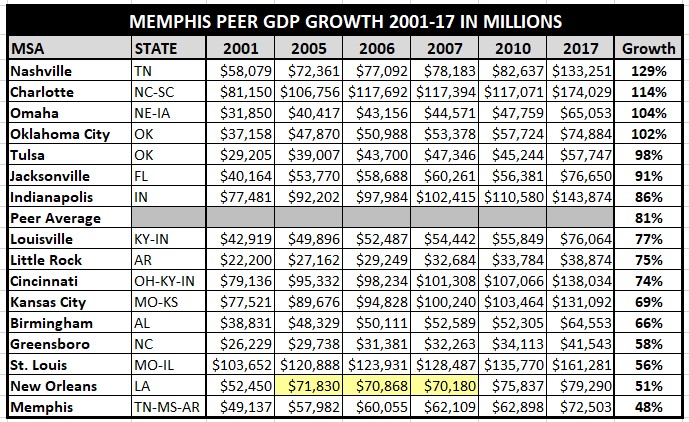
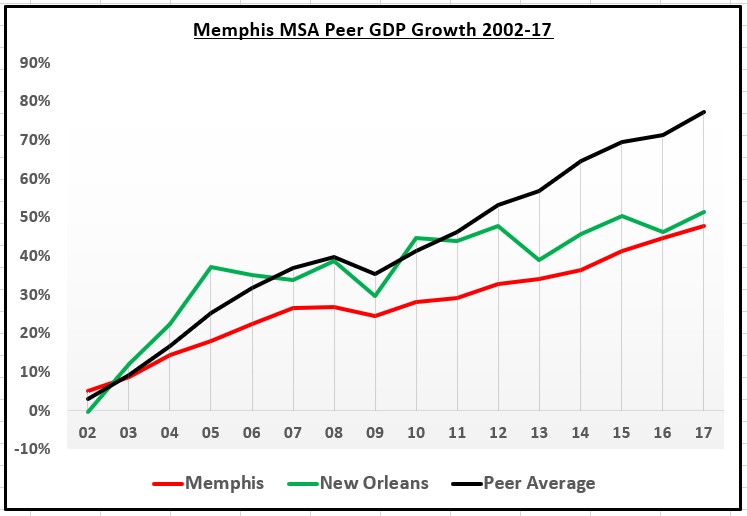
This is a different analysis with gross domestic product since the founding of Memphis Tomorrow in 2001 with peer rankings below. The Memphis Tomorrow CEO organization’s  initiatives are often funded with Federal, State and Local tax dollars for community economic development. The comparison with New Orleans is because they had an external event in hurricane Katrina in 2005. Still Memphis, without an external event, the GDP growth rate trails that of New Orleans that had an external event and is at the bottom of peer rankings.

Based on a percentage analysis, $13.5B in deficient GDP growth has occurred in Memphis resulting in an estimated $5B in total wage loss and $150M in deficient tax revenues since 2001 when compared to New Orleans.

Data source is Bureau of Economic Analysis See below chart and table.

GDPChart

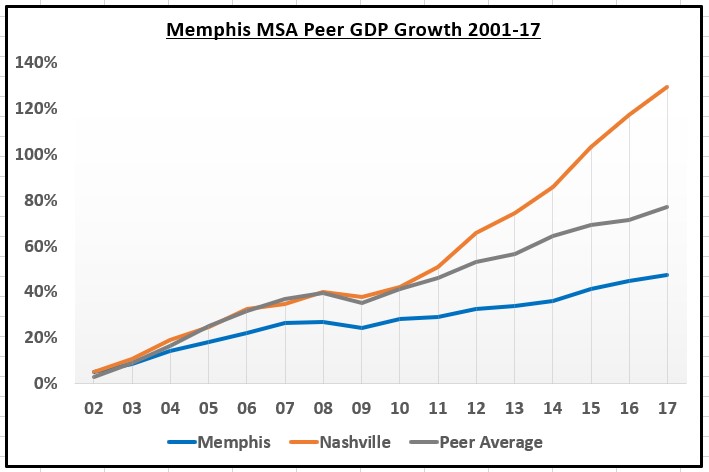
This chart shows the relationship of Memphis MSA GDP growth to its peer average and Nashville. EDGE, a Memphis Tomorrow Fast Forward initiative, was created in 2011. Based on a percentage analysis, when compared to the peer average, $131B in in deficient GDP has occurred, resulting in $49B in lost wages and $1.5B in lost tax revenue since 2001.

Further, $16B in deficient GDP has accumulated since 2001 vs the peer average resulting in annually recurring total wage deficiencies of $6B and $180M in recurring annual tax revenue shortfalls from deficient below average GDP growth since 2001. $180M would fund transit and overall city/county services to an adequate level.

GDPChart-Nash

Memphis MSA peer rankings.

GDP-Ranking


Pages

  • ABOUT
  • Attribution
  • CONTACT
  • CRISIS IN SYSTEM CONFIDENCE
  • DAILY MEMPHIAN: Actively Censoring Free Speech
  • DATA: For Shelby County Macroeconomic Analysis
  • DEFICIENT ECONOMIC DEVELOPMENT – TAXPAYER LOSS
  • Economic Development Growth Engine (EDGE)
    • EDGE Public Comment – 06/20/18
  • EDGE Retention PILOT Program (A Memphis Tomorrow Bi-Product)
    • Existing and Additional Facility Capital Investment (3)
    • Existing Facility Retention PILOT Capital Investment (7)
    • Local Facility Relocation (3)
    • New and Existing Facility Capital Investment (1)
    • New Facility and Consolidation from West Memphis (2)
    • New Facility Capital Investment (2)
  • Educational Attainment Requirements by Geography
  • Greater Memphis Alliance for Competitive Workforce (GMACW)
  • Implement
  • IT’S WEIRD
  • Median Age vs Memphis Peers
  • Memphis Chamber of Commerce
  • Memphis Raise Your Expectations (MRYE) Economic Development #BalanceMemphis
  • Memphis Tomorrow Executive Committee – $124M in taxpayer shortfalls
  • MRYE Memphis Economic Development Survey
  • MWBE DASHBOARD
  • PUBLIC PARKING PORN
  • RESOURCES
    • Memphis City Council Attempted Comment Not Heard – 06/19/18
  • SOLUTION
  • What Does $124M Look Like in Community Benefit ?
  • WORKFORCE: Lost Decade

Archives

  • November 2024
  • April 2022
  • February 2022
  • January 2022
  • December 2021
  • November 2021
  • October 2021
  • September 2021
  • August 2021
  • July 2021
  • June 2021
  • May 2021
  • April 2021
  • March 2021
  • February 2021
  • January 2021
  • December 2020
  • November 2020
  • October 2020
  • September 2020
  • August 2020
  • July 2020
  • June 2020
  • May 2020
  • April 2020
  • March 2020
  • February 2020
  • January 2020
  • December 2019
  • November 2019
  • October 2019
  • September 2019
  • August 2019
  • July 2019
  • June 2019
  • May 2019
  • April 2019
  • March 2019
  • February 2019
  • January 2019
  • December 2018
  • November 2018
  • October 2018
  • September 2018
  • August 2018
  • July 2018
  • June 2018

Categories

  • Chamber Alliance (1)
  • City Council (4)
  • County Commission (3)
  • Economic Development (1)
  • EDGE (2)
  • Memphis Tomorrow (2)
  • Public Comment (7)
  • Strip (1)
  • Uncategorized (271)

WordPress

  • Log in
  • WordPress

Subscribe

  • Entries (RSS)
  • Comments (RSS)

Pages

  • ABOUT
  • Attribution
  • CONTACT
  • CRISIS IN SYSTEM CONFIDENCE
  • DAILY MEMPHIAN: Actively Censoring Free Speech
  • DATA: For Shelby County Macroeconomic Analysis
  • DEFICIENT ECONOMIC DEVELOPMENT – TAXPAYER LOSS
  • Economic Development Growth Engine (EDGE)
    • EDGE Public Comment – 06/20/18
  • EDGE Retention PILOT Program (A Memphis Tomorrow Bi-Product)
    • Existing and Additional Facility Capital Investment (3)
    • Existing Facility Retention PILOT Capital Investment (7)
    • Local Facility Relocation (3)
    • New and Existing Facility Capital Investment (1)
    • New Facility and Consolidation from West Memphis (2)
    • New Facility Capital Investment (2)
  • Educational Attainment Requirements by Geography
  • Greater Memphis Alliance for Competitive Workforce (GMACW)
  • Implement
  • IT’S WEIRD
  • Median Age vs Memphis Peers
  • Memphis Chamber of Commerce
  • Memphis Raise Your Expectations (MRYE) Economic Development #BalanceMemphis
  • Memphis Tomorrow Executive Committee – $124M in taxpayer shortfalls
  • MRYE Memphis Economic Development Survey
  • MWBE DASHBOARD
  • PUBLIC PARKING PORN
  • RESOURCES
    • Memphis City Council Attempted Comment Not Heard – 06/19/18
  • SOLUTION
  • What Does $124M Look Like in Community Benefit ?
  • WORKFORCE: Lost Decade

Archives

  • November 2024
  • April 2022
  • February 2022
  • January 2022
  • December 2021
  • November 2021
  • October 2021
  • September 2021
  • August 2021
  • July 2021
  • June 2021
  • May 2021
  • April 2021
  • March 2021
  • February 2021
  • January 2021
  • December 2020
  • November 2020
  • October 2020
  • September 2020
  • August 2020
  • July 2020
  • June 2020
  • May 2020
  • April 2020
  • March 2020
  • February 2020
  • January 2020
  • December 2019
  • November 2019
  • October 2019
  • September 2019
  • August 2019
  • July 2019
  • June 2019
  • May 2019
  • April 2019
  • March 2019
  • February 2019
  • January 2019
  • December 2018
  • November 2018
  • October 2018
  • September 2018
  • August 2018
  • July 2018
  • June 2018

Categories

  • Chamber Alliance (1)
  • City Council (4)
  • County Commission (3)
  • Economic Development (1)
  • EDGE (2)
  • Memphis Tomorrow (2)
  • Public Comment (7)
  • Strip (1)
  • Uncategorized (271)

WordPress

  • Log in
  • WordPress

CyberChimps WordPress Themes

© MCCL