Corporate/real estate incentives in Memphis and Shelby County approach $120M per year. $50M of the $120M per year in incentives can be shown to be excessive, resulting in $500M in deficient public investments over the last 10 years. This formula is a design for community decline.
This blog will discuss lacking governmental oversight of Memphis/Shelby tax incentives, while through research, conclusively proving excessive corporate/real estate incentives occurring on the back of majority black community in need.
Lacking Governmental Oversight
Reid Dulberger testified before the County Commission on June 3rd regarding the Economic Development Growth Engine’s (EDGE) quarterly report. No specific questions were asked by Commissioners about the contents of the report. The report included an excessive $38M UPS incentive award and a Blues City award. Al Bight, EDGE Board Chair, recused himself from voting on Blues City, indicating a conflict of interest.
Blues City was awarded a second $3.6M payment-in-lieu of taxes (PILOT) incentive, even though Blues City had not met employment targets in their existing PILOT. Additionally, with the new PILOT, the committed MWBE spend was less than 1% on a $50M Blues City project. Unfortunately, Commissioners did not ask any specific questions regarding the former facts.
Commissioner Michael Whaley did ask EDGE to provide comparative data on other cities PILOT practices and amounts. Dulberger’s response was effectively, that he would see what he could find, while referencing EDGE’s commendable transparent database.
While Dulberger is a highly competent bureaucratic administrator, he is unlikely to provide any data that would, in any way, indict the policies and practices of EDGE. Besides, his Board would not want him to provide such documentation as it would be foolish to do so.
To that extent, Dulberger’s legitimate defense is to point local legislators to the legislatively unquestioned data that has been regularly published for years. With comparable data, the EDGE database is the very data that Commissioners could use to prove excessive corporate/real estate awards occurring on the back of a majority black community in need.
So comparable reliable tax incentive data and improved oversight is needed in the public discourse.
About Tax Incentives and Comparable Data
Given the above reality, in concert with EDGE available data, below are some reliable data sources that local legislators can use to prove taxpayer injustice as administered through excessive corporate/real estate incentives. And the excesses extends beyond just EDGE, with 8 other abating boards, whose data is not transparent as EDGE data.
Nine local abatement boards in Shelby County administer all or a subset of job tax incentives, real estate development incentives and tax increment financing (TIF). Job tax incentives, exercised through payment-in-lieu of taxes (PILOT), are used to induce job growth. Job PILOTs are administered by EDGE and 5 municipal industrial development boards.
Real estate tax incentive PILOTs are used to induce development for blight reduction, market rate residential multifamily housing and affordable housing. EDGE, Downtown Memphis Commission and 2 Health Education Facility Boards, all administer some form of real estate development incentives.
TIFs are administered by various agencies, some of which, are not discussed in this blog. TIFs direct additional incremental tax revenue from development, to a predefined area or TIF district, to offset the cost of public infrastructure in support TIF area development. TIFs will not be discussed below, as there is unfortunately, no governmental publication that quantitatively discloses TIF development subsidies.
Historic Shelby County Trustee Reports and Budget Documents – Compilation of the data for all types of tax incentives, contained in the above linked documents, reveals that between 2008-18, that in exchange for promised tax revenue growth, $497M in tax incentives were provided for only $114M in year over year Shelby County tax revenue growth. This would result in a structural revenue problem with a $383M difference based on active PILOT contracts. Or, for the Shelby County taxpayer to merely breakeven with abatements, a $192M tax revenue shortfall results.
A similar analysis can be extrapolated for Memphis, from historic Shelby County Trustee reports and using historic City of Memphis Budget documents. The City of Memphis does not have historic PILOT reports published. Given this, the following extrapolation can be conducted using the historic Shelby County Trustee PILOT reports. From 2010-18, in exchange for an estimated $348M in tax incentives, the City of Memphis generated $120M in total year over year tax revenue growth. The former results in a $228M difference and a Memphis taxpayer breakeven shortfall of $114M.
Therefore, a total $306M Memphis/Shelby taxpayer breakeven revenue shortfall results between 2010-18 ($192+114M=$306M). This blog consistently states a recurring estimated annual $50M taxpayer revenue shortfall results from excessive Memphis/Shelby County tax incentives. If some tax revenue growth above granted incentives is expected, the findings of this analysis, using actual data, would support a $50M annual tax revenue shortfall from excessive incentives. This shortfall results in a structural revenue problem for local government.
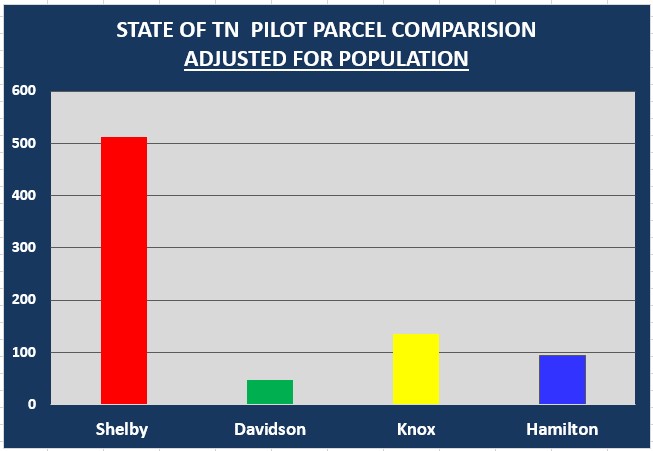
State of TN Comptroller PILOT Report – By counting the number of parcels under PILOT contract, for all types of incentives and abating boards, Shelby County has 512 parcels under contract, Davidson-35, Knox-68 and Hamilton-37. Additionally, Shelby County is the only County in the state offering residential PILOTs. The local excess is clear with these active PILOT contracts. The following link is an extract of above counties from the 2019 State of TN Comptroller PILOT report. See below comparison graphic which has been adjusted for population:
Research and Making Sense of Incentives – If economist Dr. Timothy Bartik’s Upjohn sponsored tax incentive research were applied to approved job tax incentives, it would reduce EDGE projected revenues from $1.44B to $183M for incentives approved through June 2020. Applying Bartik’s research requires multiplying EDGE’s $1.44B by 12.5% and results in an approximate $1.26B EDGE revenue overstatement. And based on $619M in abated taxes, would result in a Memphis and Shelby County tax revenue shortfall of $436M ($183M-$619M) over the entire life of EDGE abatement awards. That would be $243M to Shelby County and $193M to Memphis in shortfalls. This data is based on EDGE approvals and represents both active and potentially active contracts.
As shown in the first section, using actual data over 8 years, there already exists evidence of a $306M Memphis/Shelby County tax revenue breakeven shortfall, from active incentive contracts, for all abating boards. This actual data observation would lend strong support to Bartik’s research findings for active and approved job incentives given typical abatement life terms exceeding 10 years.
As for EDGE, they use the Bureau of Economic Analysis RIMS II research base for economic projections. However EDGE, in their use of RIMS, does not account for 1) some probability that the economic impact would happen without a 75% incentive, 2) the economic impact of the remaining workforce upon a company departure when projecting impact for retained jobs or 3) the economic impact of investing existing taxes abated into the community. Close reading of the RIMS technical material will reveal these deficiencies in EDGE’s economic impact modeling and use of RIMS II. See video demonstration:
Further, recent research from Slattery and The Economic Policy Institute, aggressively question the throughput of projections that use economic multipliers, as EDGE does with RIMS II, especially for low wage warehouse jobs.
When the above is factored into current EDGE projection modeling, one easily arrives at a figure similar to the 12.5% Bartik concludes in his research regarding tax revenue projections from job incentives. Couple the former with an examination of actual Memphis/Shelby public revenue growth, since 2010 and strong support for applying Bartik’s research is shown.
Applying a version of Bartik’s research is shown below against $703M in locally approved job incentives to include EDGE, Collierville Industrial Development Board and Downtown Memphis Commission’s FedEx Downtown award. Under Bartik, $344M would have been approved as opposed to $703M in job tax incentives. And for that matter, $344M in approved job incentives is hardly anti tax incentive.
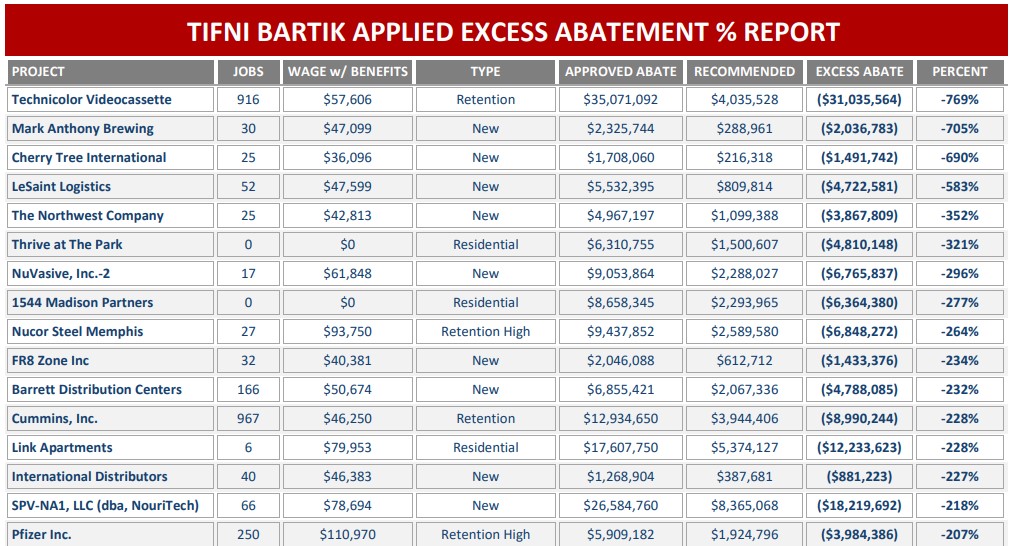
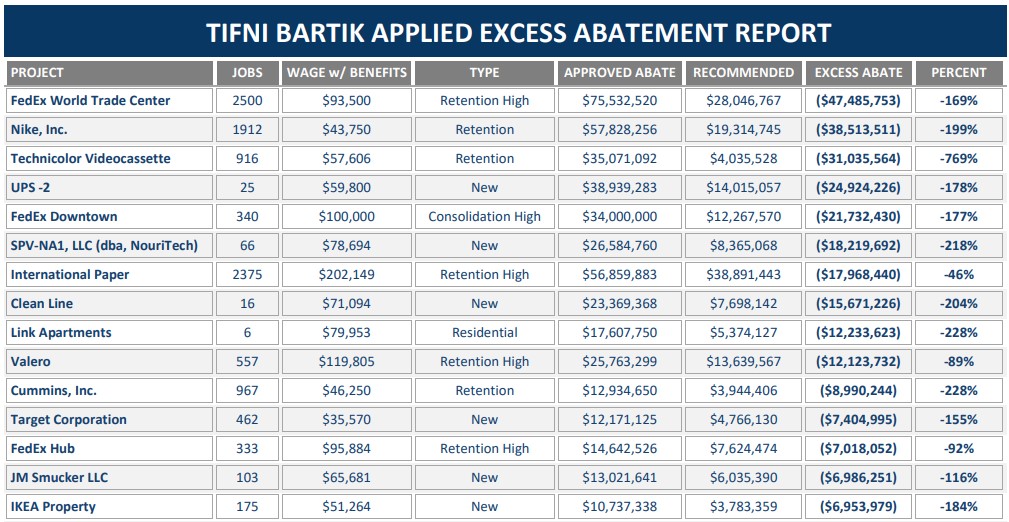
The following linked full reports, that apply Bartik, rank the most excessive incentives by percentage and dollar amount. To view the smaller print in the below report images, click on the image.
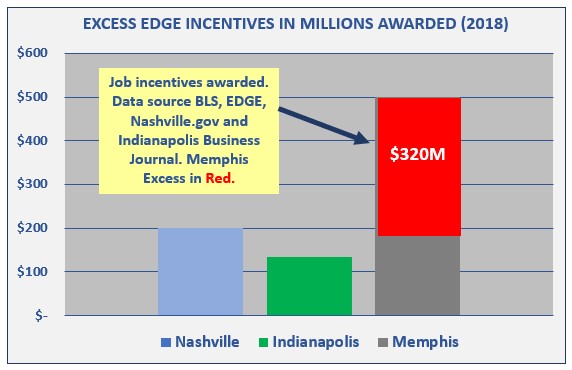
Comparative Nashville and Indianapolis Data – Comparative incentive policy can be discerned by reviewing these 2 data sources. These 2 linked data sources, combined with Bureau of Labor and Statistics data, result in the comparative data charts in this blog.This analysis results in the discovery of $320M in excess EDGE job incentives when factoring in the higher Memphis/Shelby property tax rate.
Atlanta, Louisville and Memphis UPS incentives – This comparative analysis was done on similar UPS expansion approvals in 3 hub cities. By comparing the total jobs, wages, capital investment and adjusting for the higher Memphis/Shelby tax rate, it can be determined, based on incentive awards in other cities, that the EDGE UPS Memphis $38M award is in excess by $24M and should be $14M.
It further appears, that Atlanta and Louisville, use something similar to Bartik’s research findings to more responsibly size their tax incentives. To see, the tax incentive fiscal note impact (TIFNI) tool and Bartik in action, review the following sizing reports for the UPS Atlanta, Louisville and Memphis projects.
The TIFNI Bartik tool, used to generate the above reports, recommends an incentive close to the Atlanta and Louisville awards, while the Memphis UPS incentive award is $24M in excess. It shows that other cities are using some approach similar to Bartik in sizing their job incentives.
Keep in mind, through fee revenue, Memphis/Shelby abating boards are rewarded for offering as many and as large incentives as possible. For example, EDGE will pocket, upon closing, $300K for the excessive UPS Memphis PILOT award. This fee structure is a design for community decline.
Conclusion and Solutions
The data is conclusive to support $50M in recurring Memphis/Shelby annual tax revenue shortfalls and $500M in deficient public investments, over 10 years, from elitist and excessive tax incentives. To summarize, five different research based methods were used to expose excessive Memphis/Shelby tax incentive policy implementation. The summary findings are as follows:
A $306M Memphis/Shelby breakeven tax revenue shortfall results, when using actual data from 2010-18, for all types of active incentive contracts from all abating boards
Per the 2019 State of TN Comptroller PILOT report, Shelby County exceeds its municipal peers by more that 3x, on parcels under active PILOT contract.
In 2 applications of Dr. Timothy Bartik’s Making Sense of Incentive research, a $359-$436M tax revenue shortfall results, from excessive job incentive approvals, which include both active contracts and approvals. Approvals will potentially become active contracts.
In a benchmarking that adjusts for the higher local property tax rate, while comparing Memphis, Nashville and Indianapolis job incentives through 2018, a $320M tax revenue shortfall is revealed for EDGE incentives.
While adjusting for the higher Memphis/Shelby property tax rate, an excessive EDGE UPS Memphis incentive approval occurred, by $24M, when compared to similar projects in Atlanta and Louisville.
Overall concerning, is the number of PILOTs granted for existing local businesses and the fee structure that rewards abating boards for offering excessive incentives. Solutions to manage, size, measure and publicly communicate information regarding tax incentives, include the following:
An implementation of Dr. Timothy Bartik’s research to size job incentives
A fiscal note for every abatement, otherwise known as tax incentive fiscal note impact (TIFNI)
A Shelby County Government administered consolidated database to size incentives, house and standardize all incentive information for 9 abating boards, to facilitate oversight, transparency and community measurement.

