Memphis Corporate Community Leadership Measured

  • ABOUT
  • MWBE
  • SOLUTION
  • IT’S WEIRD
  • RESOURCES
  • CONTACT
  • MRYE

THE EDGE SCANDAL AND COVERUP: Fiscal Impact

September 29, 2019 Joe B. Kent Uncategorized

EDGEScandal

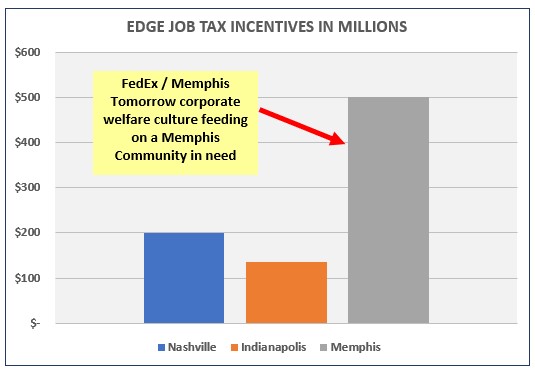
The EDGE Scandal results from a lack of fiscal impact analysis regarding some $500M+ in EDGE abatements over 8 years. EDGE has been referencing economic impact analysis to justify excessive corporate/real estate incentives which does not address the fiscal impact of abating taxes. According to the Bureau of Economic Analysis, that houses the Regional Input-Output Modeling System (RIMS) II used by EDGE, the RIMS II system cannot be used to conduct a complete fiscal impact analysis.

But in a rigged elitist Memphis system, this lacking accountability, as a matter of process, is just normal operating procedure. After almost 20 years, local leaders know nothing else under the rigged FedEx/Memphis Tomorrow system. The fact is that a fiscal note should accompany each tax abatement as a matter of process.

Unalarmed are such leaders as Kemp Conrad, Gerre Currie, Martavius Jones, Brandon Morrison, Edmund Ford and Mickell Lowery. All of these leaders have both academic and professional resumes that support competency in business and finance matters. But that expertise is being squandered in serving a Memphis community in need as excessive corporate/real estate incentives roar.

Jones has stated that it takes one full term to learn the job of a City Councilman. But it takes no time to be alarmed at gross fiscal process gaps ! Alarming, is the lack of alarm by local officials fluent in business and financial affairs.

Fiscal Impact

Using economic impact analysis without fiscal impact analysis lays the foundation for excessive corporate/real estate incentives that feed on a Memphis community in need while not serving the business community with adequate public support services. Excessive incentives are not good for business.

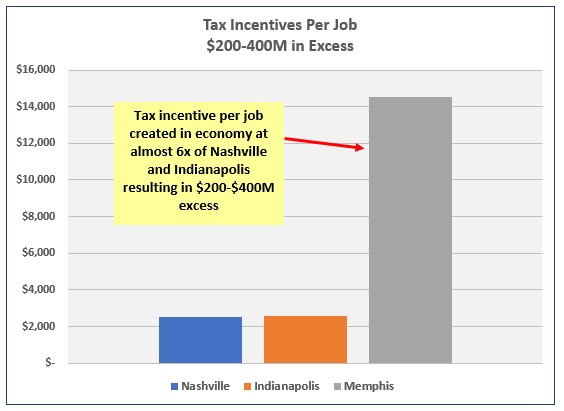
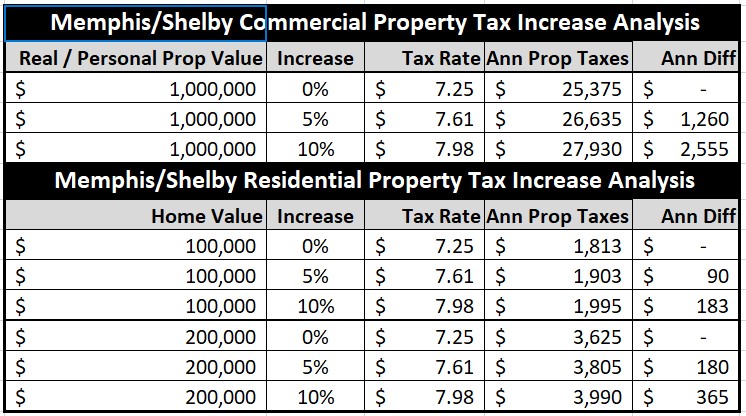
Using responsible assumptions, this spreadsheet imposes a fiscal impact analysis on EDGE abatements. The spreadsheet finds almost $300M in excessive job incentives when appropriate fiscal impact analysis is imposed. The major assumptions in the modeling include return on investment criteria individually for existing property and new capital investment property tax abatements.

Additionally, another major assumption concerns the per employee cost of locally funded public services that needs accounting for in a fiscal impact model while supporting the local economy. Arguments for this cost can range from $1,600 to $2,500 per employee to support the free enterprise system. If such costs are not accounted for, employers and the local community will not be adequately serviced resulting in the public’s diminished ability to serve the local economy while attracting new business investment.

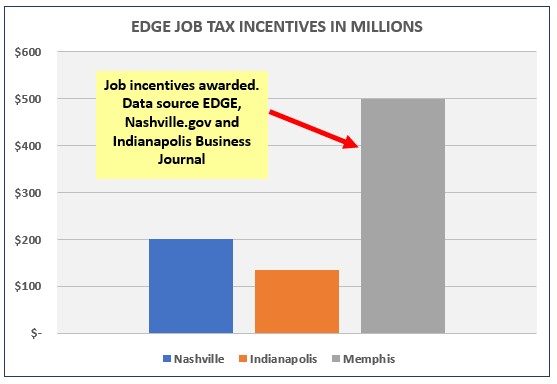
Unlike the previous EDGE Scorecard analysis blog, the spreadsheet analysis makes accommodations for expected EDGE arguments and subtracts abated new cap x property taxes out of total project costs. The responsible assumptions used in the analysis end up recouping the entire $515M abated for taxpayers over a 13.5 year weighted average project life.

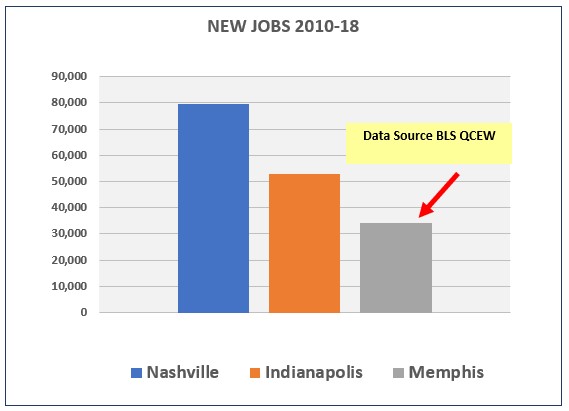
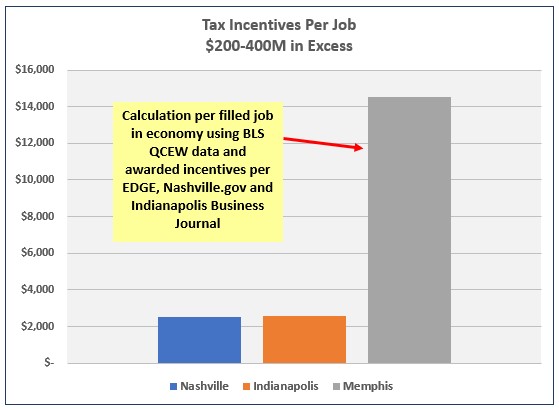
Before this fiscal impact analysis, it was determined through peer city benchmarking that job incentives were as much as $400M in excess. The spreadsheet can be downloaded for public use and can accommodate varying assumptions in the blue shaded area. But for whatever reason, fundamental fiscal impact of excessive tax abatements was not addressed in City/County EDGE task forces. Wonder why ?

EDGE Coverup

coverup

Last year, amidst concerns of EDGE bogus projection accounting, massive corporate/real estate incentives and below average total wage growth, City / Council EDGE task forces were formed. EDGE first originated as a Memphis Tomorrow Fast Forward initiative.

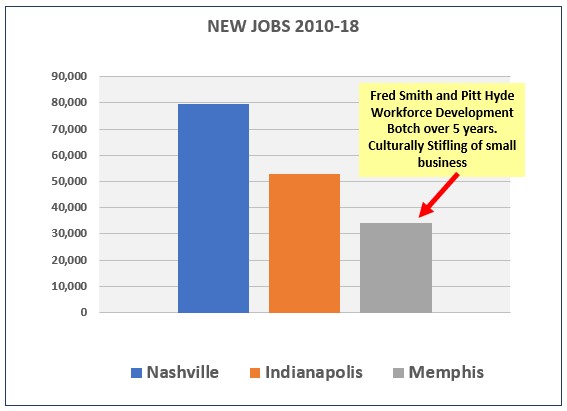
Councilman Berlin Boyd and Commissioner Willie Brooks, both employed by FedEx at the time, chaired the task forces. But there was no real EDGE reform. The EDGE Board was preserved in its current form while excessive incentives and botched workforce development efforts went unaddressed. It was a coverup of sorts resulting in a lack of course correction, a key indicator of a rigged system.

The only outcome was the creation of yet another “convening” economic development body called the Shelby County Regional Economic Alliance. So far, it has been a cheerleading group of sorts where almost 2 years since Richard Smith took over as Board Chair of the Greater Memphis Chamber, there is still no plan or measurable definition for economic development.

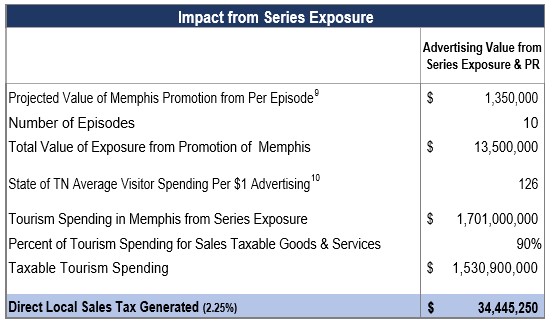
In the meantime, the entitled spooner elitists  continue to bully and feed on a Memphis community in need with excessive incentives without fiscal justification. In addition, to the excessive abatements, EDGE even misused some $1.7M in Depot funds that should have gone back to the taxpayer. The lack of fiscal impact analysis, as standard operating procedure over 8 years, proves an unchecked, entitled elitist spooner system bullying and feeding on a Memphis community in need. All of this occurs under the nationally embarrassing FedEx/Memphis Tomorrow corporate community leadership complex as a new poverty report shows increases in poverty.

Conclusion

So how to evaluate EDGE ? Well it starts with a fiscal impact analysis. Some local legislators seem to want to load up the evaluation with EDGE over performance. But that wouldn’t be fiscally conservative while not accounting for the business cycle. And how would the botching of the workforce development system and the loss of Electrolux, all under EDGE management, be accounted for ?

The proposed solution of 50% abatement on new cap x, provided current job levels are maintained and a 1% abatement on total wages with EDGE investment and term minimums maintained, right sizes PILOTs.

At any rate, the nationally embarrassing FedEx/Memphis Tomorrow complex, of which EDGE is a part, enjoys the support of lacking public university thought leadership, press and legislative oversight to confront elitist excesses that further irritate community imbalances. This has resulted in systems of decline being culturally engrained into the Memphis community leadership system. Rigging the system is seen as proficiency in evolving the ecosystem. But rigged systems don’t result in competitive economic growth; something Fred Smith must have missed in his history curriculum.

And sadly, ignorant of anything else after 20 years, local leaders only know rigged systems of decline. This leaves educated leaders unalarmed by gross fiscal process gaps further normalizing ecosystem decline while ignorantly viewing the nationally embarrassing FedEx/Memphis Tomorrow complex as visionary.

So, its more of the same in a design for ecosystem decline……


EDGE SCORECARD RECALCUATED: Following RIMS II Guidance

September 21, 2019 Joe B. Kent Uncategorized

RIMSII

THE CALCULATIONS IN THIS BLOG CHANGED SLIGHTLY FROM ITS ORIGINAL PUBLICATION

The Regional Input-Output Modeling System (RIMS II), used by EDGE and housed at the Bureau of Economic Analysis, lays out clear guidance on its limitations and use in projecting economic impact. But EDGE has not followed its gudiance for the purpose of abating taxes.

This blog will follow RIMS II guidance to recalculate the EDGE Scorecard. To quickly summarize, the blog finds $200M in excessive job PILOT abatements when using RIMS II. This finding in no way results in the elimination of PILOTs but advocates for PILOT reform to address excess. The blog leaves open the question of how much Memphis might have excess abatements in some 9 other abating boards outside of EDGE.

As part of the FedEx/Memphis Tomorrow entitled spooner complex, the RIMS II system implementation has been botched to afford excessive incentives for the small few. Its stunning that the FedEx/Memphis Tomorrow complex botched the workforce development system while awarding excessive incentives for corporate/real estate interests. But at their very core, the spooners in Memphis feel entitled to feed on a community in need, as other communities propel forward under more responsible community leadership. The basic lie and spooner entitlement underwrites the perennial Memphis decline.

RIMS II LITERATURE

To recalculate the EDGE Scorecard, using RIMS II, adjustments to cost and projected revenue must be made. Prior to this recalculation using RIMS II guidance, this blog has been saying that job incentives are $200M+ in excess when benchmarked against other communities. That assertion is effectively revealed in the recalculation of the EDGE Scorecard using RIMS II guidance.

Cost. First this recalculation accepts the use of RIMS II economic multipliers because when fully following RIMS II guidance the use of multipliers makes sense. RIMS II states:

For important decisions, fiscal impact and economic base studies can be used to complement an economic impact study. These studies estimate the costs of local government services needed to support development projects. These costs include any new spending on public infrastructure or any cash incentives to attract new businesses. More sophisticated fiscal impact studies also consider the expected costs of providing more public services, such as education and public safety, resulting from economic growth.

The fiscal benefits of a project—which include increased revenue from taxes, fees, and user charges—are typically subtracted from the costs of public services to summarize the results of the study. If additional tax information is provided, an I-O model can be used to estimate the expected increases in tax revenue from a project. However, an I-O model cannot be used to conduct a complete fiscal impact analysis.

Abating taxes is an important decision. At the same time, RIMS II guidance clearly states that it alone is not suitable for estimating fiscal impact. Or said another way, RIMS II alone is not suitable for estimating the fiscal impact of abating taxes. EDGE has not been following RIMS II guidance to fully estimate the fiscal impact of abating taxes. The above guidance will be used to recalculate the cost of supporting new jobs in the economy in addition to the actual tax abatement. EDGE only calculates abatement costs when considering tax abatements. This results in an incomplete analysis while paving the way for excessive corporate/real estate tax abatements.

Another note from RIMS II guidance provides this example:

To give an example of how intangible benefits may play a role in the decisionmaking process, consider the case where local officials must decide whether to open a new fire station. An economic impact study may show that the impact of the operation of the station will result in only 10 new jobs. Yet if the local government’s main objective is to increase public safety, this estimate of new jobs will not provide all of the information needed to make the decision.

This note eludes to the need to provide an offset calculation for investing in the local community as opposed to awarding excessive tax incentives to corporations that serve global audiences.

Revenue. This RIMS II case study states the RIMS II does not consider potential offsetting re-employment of the labor and capital upon industry departure but can be used if some idea of re-employment is provided. EDGE assumes in their retention PILOT economic impact studies all new revenue from retention abatements, which in effect assumes that if the employer is not retained in Shelby County, that the entire tax base associated with the economic impact of that company dies.

This is an irresponsible and scandalous assumption which results in inflated revenue for retention PILOTs and the EDGE Scorecard. The EDGE Board should have assumed something beyond death of the entire tax base when considering retention abatements. A responsible assumption will be made that adjusts projected revenue downward for the EDGE Scorecard pertaining to retention PILOTs.

EDGE SCORECARD RECALCULATION

EDGE Recal2

This EDGE Scorecard recalculation does the following while using RIMS II guidance:

  1. Accounts for public service cost in supporting employed jobs
  2.  Accounts for existing community revenue credit revenue by subtracting if from EDGE claimed revenue
  3. Accounts for remaining tax base in the event of company departure while assuming a 50% retention rate

Cost Recalculation. Unaccounted cost in the Memphis system to support economic development show up in the form of depleted services in transit, education and public safety. To account for these unaccounted cost, per RIMS II fiscal impact note guidance, we assume it costs $1,000 per year in local government expenditures to support each local job. Our methodologies are disclosed at the end of the blog.

95 EDGE Board approved PILOTS were reviewed. The excessively incented FedEx Downtown project was excluded as it was mostly a Downtown Memphis Commission project. To support 40,272 total direct and indirect jobs, per the 95 PILOTs reviewed, across multiple PILOT terms, the additional cost in addition to the EDGE Scorecard abatement cost of $515M results in an additional system cost to support those jobs of $542M. That results in a total revised EDGE Scorecard cost from $515M to $1.06B.

Revenue Recalculation. Based on the RIMS II case study note, for retention PILOTs, we make a responsible assumption, away from death of the entire entity associated tax base, that 50% of the tax base in existing direct and indirect jobs will be retained upon a company departure. This calculation results in a $398M reduction to EDGE Scorecard revenue from $1.336 to $938M. Next existing taxes found in community revenue credit revenue of $44M is subtracted to result in $894M in recalculated EDGE Scorecard revenue.

EDGE Scorecard Net Recalculation. The final recalculation of the EDGE Scorecard results in $894M in revenue and $1.06B in overall community cost to result in a net deficit of $166M. EDGE claims a $821M gain. The difference between the recalculation and the EDGE claim is ($987)M.

At a minimum, EDGE job incentives are $166M in excess when applying RIMS II guidance for a stagnant breakeven state. This would result in right sized incentive amount of $349M down from EDGE’s $515M for a stagnant state. Or if taxpayers were to make at least as much as EDGE at 5%, it would drop the incentive amount by $359M based on this evaluation from $515M to $156M. Both amounts lead to the conclusion, that EDGE incentives are $200M+ excessive.

CONCLUSION

Service gaps due to excessive incentives are detrimental to both the community and local business. Educating the community about these costs will help right size incentives.

Fiscal impact when abating taxes for economic development is a legislative budget and not a economic development committee issue. If local legislators want to add back in EDGE’s claimed portfolio over performance in more fully evaluating EDGE, that’s fine. But considering that over performance is not fiscally conservative by not considering the business cycle.

The proposed 50% abatement on new capx only and 1% on total wages both provided if current job levels are maintained, while maintaining EDGE investment and term minimums, would right size job PILOTs for the future. Additionally, changes need to be made away from incenting abating boards to represent corporate/real estate interests over the taxpayer. This in itself is scandalous.

In the end, Memphis cannot propel forward on a stack of lies as the entitled elitist feed on a community in need without reliable measurement, legislative and press oversight and independent university thought leadership. Without the former, this is an ecosystem design for decline.

METHODOLOGY

Job Support Costs – Total Memphis/Shelby costs in public safety, $30M total for transit and K-12 education were totaled to be $1.05B and divided by 2 resulting in a total public spend of $525M to support jobs in the local economy based on a 50% employed population. The $525M was then divided by 500K employed jobs in the local economy to arrive at a cost $1,050 in cost per job. $1,000 was used in the study.

Revenue Adjustment – Retention PILOTs revenue was adjusted downward based on the assumption that the entire tax base does not die upon a company departure while assuming 50% of the tax base would be retained in the event of a corporate departure. When companies depart, they typically take 30% or less of their workers. Assuming a 50% retained tax base upon a company departure, would assume a 30% negative impact to the remaining tax base upon a company departure.


SPOONERS: A NATIONAL EMBARASSMENT

September 19, 2019 Joe B. Kent Uncategorized

SPOONERNational

SILVER SPOONER ELITISM: How Can The State Invest In Systemic Decline ?

September 18, 2019 Joe B. Kent Uncategorized

silverspoon2

Governor Lee,

Entitled silver spoon elitism is the root cause for systemic Memphis decline. Just as many of us feel entitled to draw our next breath, the Memphis spooners feel entitled to run their city in the ground while using federal, state and local tax dollars. The Memphis Tomorrow CEO organization, a national embarrassment, is down in every category over almost 20 years as their initiatives feast on taxpayer dollars.

So how can state taxpayers afford to invest in systems of decline? After all the FedEx/Memphis Tomorrow CEO complex has been content with decline for almost 20 years. Local leaders fall in line with Memphis Tomorrow leadership modeling, while lacking the human systems, checks and balances to evolve the ecosystem.

Local leaders in the political establishment, press and university complex are not alarmed at the deficiencies found in GDP, employment, total wage growth and botched systems and corresponding excesses found in tax incentives implementation that point to the entitled spooners feeding on a Memphis community in need. Deficient Memphis Tomorrow CEO membership is arguably more expensive than the natural $161B disaster of Hurricane Katrina, where Memphis trails New Orleans in GDP growth. In this way, community decline has been institutionalized as the resident population is dismissed.

For my part, I have been cursed with having worked in other communities throughout the country and the ability to compile a few data tables. The former curse and landing in Memphis, forced me to ask the question, “What the hell is going on here?” I have never witnessed in other communities such engrained processes of decline. People live in a bubble here, disconnected from critical economic development measurement while competing against Northern Mississippi and Eastern Arkansas in a global economy. I wonder at times if Fred Smith and Pitt Hyde have ever left Memphis.

One has to wonder, what Smith, a history buff, expects to happen in the system when elitism that feeds on a community in need is so systemically apparent?  Does he expect data informed dissent to play a role in an American Democracy or does he expect entitled spooner corporate socialism to continue unchecked while wrecking the local Memphis ecosystem. While there are ups and downs with the business cycle, Memphis has declined as a competitive ecosystem over almost 20 years.

My guess is, after almost 20 years of Memphis Tomorrow, Smith expects more corporate socialism that has stifled local GDP growth. workforce development and the emersion of needed small business establishments to power the local economy. Again, its not clear to me that Smith has ever left the City of Memphis except maybe for his legendary trip to Las Vegas to save the day at the Blackjack table.

While there have been several concerning events here in Memphis for me like getting kicked out of the Chamber without cause, seeing the workforce development system botched by the entitled spooners from the top of the ecosystem and watching business leaders systematically deploy bogus projection accounting to justify excessive incentives, the lost records by the Shelby County Schools also caught my eye.

A few years back, I was calling on the Atlanta School System and would witness rather strange occurrences. Soon after that a cheating scandal was uncovered. The Superintendent, Beverly Hall was fired while Atlanta educators faced prosecution. Here in Memphis when the grading scandal broke, there was a big production of an investigation only to conclude without a verdict and lost records. Lost records ! Are you freakin kidding me ? That’s a whole other investigation. But this lack of measurement and verdicts is what underwrites local Memphis decline within a rigged system.

And Smith and Hyde further botched the Memphis workforce development system over five years while dismissing small business solutions, while failed Canadian contracts were awarded. Now business to address the issue after fiver years is slushed out to local non-profits, and multiple out of town players like YouScience, Burning Glass and Talent Pipeline Management. I could have had this matter resolved 5 years ago as a local small business. But that is what corporate socialist do, as a matter of process, is stifle small business and the workforce development system. Its in the data and a design for ecosystem decline.

While there are ups and downs with the business cycle, how can state taxpayers invest in a declining Memphis ecosystem ? Sure the spooner elitist will tell the state what they want to hear and that they will do better. But they really don’t know how to do any differently. They only know systems of decline as modeled from Memphis Tomorrow. Listening exclusively to the same people in Nashville will not help Memphis or the State.

And most of all, entitled spooner elitism and corporate socialism doesn’t work for anyone, to include in the end, the elitst spooners at the top…..


PROPERTY TAX – 10% RATE INCREASE

September 17, 2019 Joe B. Kent Uncategorized

Proptax10

THE LEADERSHIP GAP AND GDP

September 14, 2019 Joe B. Kent Uncategorized

HurricaneHack5

Memphis Tomorrow is a national embarrassment while proliferating deficient leadership practices throughout the Memphis community. In fact, using percentage analysis, the internal disaster of Hurricane Hack of Memphis Tomorrow can be shown to be more catastrophic than the $161B external natural disaster of Hurricane Katrina costing Memphis an estimated $13.5B in gross domestic product (GDP) since 2001 when compared to New Orleans.

Content with decline for almost 20 years, the Memphis Tomorrow CEO organization sets the standard and is down in all of their community development categories, while their initiatives feast upon your federal, state and local tax dollars. Since the founding of Memphis Tomorrow in 2001, Memphis has declined without an external event while not being good for anyone to include the overall business community.  Memphis is last in peer GDP growth, behind New Orleans since 2001, as the heavily taxpayer funded economic development complex goes institutionally unmeasured in Memphis. See GDP analysis section.

While the skills gap gets most of the attention, the leadership gap in Memphis is paramount. New generation leaders don’t practice legislative or press oversight of the Memphis Tomorrow complex. Social justice and economic development organizations don’t independently author and advocate policy solutions to confront community imbalances. And the university complex is impotent on matters of research based measurement to inform course correction.

The leadership gap is paramount where, because decline is all they know after almost 20 years of Memphis Tomorrow, local Memphis leaders only know systems of decline and don’t seem to know how to course correct to evolve the Memphis ecosystem. And there is no sense of urgency, in no economic development plan after some 8 years or a transit funding solution after 3 years.

Deficient Silver Spooner Leadership Modeled 

Meanwhile, just as one feels entitled to draw their next breath, silver spooner elitist hack brats in Fred Smith and Pitt Hyde (Hurricane Hack) have felt entitled to botch the workforce development system over five years, rip off local small business solutions to address community problems while allowing local solution export to foreign or out of town entities, as the economic development complex feeds on a community in need with excessive corporate/real estate incentives in an already low business cost environment. The excessive incentives occur while justifying them with bogus projection accounting. So as designed, the ecosystem declines while wrecking economic growth as new leadership sadly views the hacks as community visionaries.

That is why the question is posed, “With an eye on GDP, as an economic developer, which would you prefer  – A. Hurricane Katrina or B. Hurricane Hack?”. If you guessed, A. Hurricane Katrina, you are right. The external event of Katrina is less costly than Hurricane Hack of Memphis Tomorrow that has comparably stagnated Memphis economic growth over almost 20 years while instituting systems of decline.

One would think that Smith, a history fan, might know that rigged systems don’t work in a free enterprise system and would appreciate some level of needed dissent in the system. But Smith might not know his history or if he does, he certainly does not appreciate the application of history. The fact is that the leadership gap, as modeled by the Memphis Tomorrow complex, is the most costly gap.

Its a costly gap, that as a matter of closed system process, the complex feeds on and dismisses their own people, thinking they can evolve the ecosystem without them. They shut out their own people as they launch one new initiative after another within a sea of event pageantry. The leadership gap leaves Memphis without the vital footing to compete in the global economy.

Lacking press and legislative oversight and university complex thought leadership won’t work in any community while the leadership gap explodes in Memphis resulting in a design for eosystem decline.

Gross Domestics Product (GDP) Data 

So why would an economic developer prefer Hurricane Katrina over Hurricane Hack?  Well, its in the Bureau of Economic Analysis data. Since 2001, when Memphis Tomorrow was founded, Memphis is last among 16 peers in GDP growth and trails New Orleans who suffered a catastrophic external event. Katrina hit New Orleans in 2005. Prior to Katrina, New Orleans was exceeding the peer average in GDP growth and as shown in the chart below, GDP dipped significantly following Katrina.

At the same time, after almost 20 years, New Orleans GDP growth still exceeds Memphis. So, in this analysis, a catastrophic Katrina would be preferable to Hurricane Hack of Memphis Tomorrow that never leaves and has institutionalized rigged system decline resulting in the leadership gap.

Based on a percentage analysis, Hurricane Hack is $13.5B more costly than Hurricane Katrina in impacting GDP resulting in an estimated $5B in total wage loss and $150M in deficient tax revenues since 2001. The problem is this type of analysis is unknown in the disconnected from reality bubble of Memphis where fantasy $19B capital investment promises take center stage while distracting from reality and the work of economic growth.

See spreadsheet analysis and see below charts/tables where arguably a Memphis trendline of stagnating corporate socialism is revealed.

GDPChart

GDP-Ranking

The below chart shows the relationship between Memphis GDP growth and that of the peer average and Nashville. Nashville soared upwards from 2011 at the same time EDGE was created. EDGE is a Memphis Tomorrow Fast Forward initiative that has authored bogus projection accounting and excessive corporate/real estate PILOTs for the benefit of the small few while feeding on a Memphis community in need.

Further, while Memphis formerly competed against Dallas and Atlanta, even new peer cities that once trailed Memphis in total GDP in Oklahoma City, Jacksonville and Louisville have surpassed Memphis in total GDP. Of course, no one in Memphis is going to know this, as the Memphis economic development complex is unmeasured and unchecked, leaving Memphians ignorant while sheltered in a bubble.

Based on a percentage analysis, when compared to the peer average, Hurricane Hack has resulted in $131B in lost GDP, $49B in lost wages and $1.5B in lost tax revenue since 2001. Further, annually recurring total wage deficiencies have accumulated to an estimated $6B, resulting in $180M in recurring annual tax revenue shortfalls from deficient below average GDP growth since 2001.

See below chart and see here to access excessive tax incentive data which are justified with EDGE bogus accounting.

GDPChart-Nash

Conclusion

Hack spooner elitism is the root cause of community decline where Memphis has declined without an external event, while Memphis Tomorrow sets the standard resulting in the leadership gap. The solution is community education. But with the university and investigative press out to lunch in Memphis, that is likely not going to be facilitated from these more traditional sources that actually serve other communities.

While other communities have been doing the data driven work of true economic development, the Memphis Tomorrow complex has been feeding on its own people within a closed disconnected from reality social construct that has nothing to do with data driven economic development. All the while, they market  their efforts as economic development within a design for decline framework where the greatest casualty is leadership leaving a leadership gap and a community without the footing to compete in a global economy.

Other solutions include incentive reform, transit funding, a connected workforce development system and increased legislative and press oversight. This blog is on published and legislative record with specific solutions of the former. If you have questions regarding specific solutions, please email me at jkent@pathtrek.net

I wonder if Paragon Bank addresses the leadership gap in their economic talk on Tuesday 9/17/19 ? We will see…..


GREAT PROJECT IN BLUFF CITY LAW: WHY THE LIE ?

September 12, 2019 Joe B. Kent Uncategorized

basiclie

The basic lie that we all learn not to do in Kindergarten underwrites the Memphis decline. Beyond acceptable common puffing or hyperbole, lying, decpetion and gross misrepresentation routinely occurs with for example the better tomorrow promised by Memphis Tomorrow or the EDGE Scorecard. The EDGE Scorecard is nothing more than a platform designed to justify excessive corporate/real estate incentives for the benefit of the small few while EDGE takes in fee revenue.

And sadly, lying is institutionally  enabled by the local press, legislative bodies and in partnership with the University of Memphis of all places. It would seem that the Memphis community could depend on the UofM to use their vast resources to speak up for a community in need to drive economic development. But as an EDGE partner, lying is enabled by the UofM, through a lack of measurement and voice, further creating a platform for exacerbating community imbalances.  But, oddly, lying seems to persist even when unneeded.

Great Project – Why Lie ?

The recent Bluff City Law project, a winning project, is an example of EDGE lying when its entirely unnecessary. First, a $1.4M abatement makes sense in attracting the local production of a national network series. All that is needed to make the project inviting is a 2-3x benefit of $2.8 – 4.2m in tax revenue generated which would translate into a $100-150M economic impact.

But EDGE is estimating a $1.7B economic impact from 10 episodes of Bluff City Law. Why the lie? The series of Nashville is often used as a best practice reference. Using the statistics for Visit Music City, the average visitor spends about $500 when visiting Nashville. Based on that stat, $1.7B in economic impact from Bluff City would translate into 3.4M in additional visitors to Memphis based on 10 episodes of Bluff City Law. Are you freakin kidding me ?!?! Lets do some math below.

BluffCity

Referencing  Visit Music City, since 2012, when 124 episodes of Nashville started production, there have been 3.7M more visitors come to Nashville. If all the credit for Music City tourism increases are generously given for The Nashville series, that would translate into approximately 30,000 per episode or 300,000 for 10 episodes.

So applying the same math for Bluff City Law, 300,000 x $500 per visitor equals $150M. $150M in economic impact x 3% tax revenue factor equals $4.5M. Here’s the message a $150M economic impact and $4.5M or somewhat less tax revenue generated works for the Bluff City $1.4M abatement. Why lie ??? And why not use a more relevant best practice reference in the project summary like the commonly referenced Nashville  ?

Conclusion

Bluff City Law is a great win. Why muck it up with a big fat lie ? Because lying is the foundational basis of a leadership complex that routinely feeds on a Memphis community in need. Kinda like the lie of  North MS and East Arkansas being top Memphis economic development competitors.

How can a City evolve and compete in a global economy while being institutionally disconnected from reality ? It can’t. Institutional lying starts at the top of the Memphis ecosystem paving the way for exacerbating imbalances in Memphis where a lack of basic values in telling the truth, advocacy and oversight have culturally normed decline over 20 years…..


DATA POINTS

September 11, 2019 Joe B. Kent Uncategorized

The below data sets reveal excessive incentives in context with low employment growth since 2010. Excessive incentives along with unfilled jobs result in deficient tax revenues and the lack of funding for adequate transit, education and etc. Fully calculating the impact of excessive incentives combined with below average total wage growth result in $300M in deficient community investments since 2010 and $75M in recurring annual tax revenue shortfalls. $75M per year would provide adequate transit and $45M more for other needed services.

Slow employment growth. Data source Bureau of Labor Statistics Quarterly Census of Employment Wages (BLS QCEW)

NewJobs2

With slower employment growth, one would expect lower overall incentives vs cities with more growth. Not the case. Memphis has 50% more in job incentives at $500M+ than both Nashville and Indianapolis combined at $335M.

NewJobsIncentives2

Fewer filled jobs divided by larger incentive amounts results in high per employed job incentive amounts. Indianapolis and Nashville at $2.5k and Memphis at $14.5k. Data sources BLS QCEW, EDGE, Nashville.gov and Indianapolis Business Journal. A strict analysis here, would reveal a $400M+ excess.

Newperjob2

This table reveals a lack of small business establishments. Business establishments per 1k population. Data source BLS QCEW. 

EST2

This is a different analysis with gross domestic product since the founding of Memphis Tomorrow in 2001 with peer rankings below. The Memphis Tomorrow CEO organization’s  initiatives are often funded with Federal, State and Local tax dollars for community economic development. The comparison with New Orleans is because they had an external event in hurricane Katrina in 2005. Still Memphis, without an external event, the GDP growth rate trails that of New Orleans that had an external event and is at the bottom of peer rankings.

Based on a percentage analysis, $13.5B in deficient GDP growth has occurred in Memphis resulting in an estimated $5B in total wage loss and $150M in deficient tax revenues since 2001 when compared to New Orleans.

Data source is Bureau of Economic Analysis See below chart and table.

GDPChart

This chart shows the relationship of Memphis MSA GDP growth to its peer average and Nashville. EDGE, a Memphis Tomorrow Fast Forward initiative, was created in 2011. Based on a percentage analysis, when compared to the peer average, $131B in in deficient GDP has occurred, resulting in $49B in lost wages and $1.5B in lost tax revenue since 2001.

Further, $16B in deficient GDP has accumulated since 2001 vs the peer average resulting in annually recurring total wage deficiencies of $6B and $180M in recurring annual tax revenue shortfalls from deficient below average GDP growth since 2001. $180M would fund transit and overall city/county services to an adequate level.

GDPChart-Nash

Memphis MSA peer rankings.

GDP-Ranking


WHY DOESN’T MEMPHIS HAVE FUNDS FOR PUBLIC TRANSIT ?

September 10, 2019 Joe B. Kent Uncategorized

Bubble Fleming

Memphis doesn’t have money for public transit due to highly deficient corporate community leadership. The FedEx/Memphis Tomorrow complex is down in every category over 20 years while using federal, state and local tax dollars.

A Memphis community in need, has been bullied from the top of the ecosystem with excessive corporate/real estate incentives and botched workforce development efforts over 5 years while further trapping people into poverty with inadequate transit. This has resulted in below average total wage growth,  $300M+ in deficient community investments since 2010 and $75M in recurring tax revenue shortfalls. This is why Memphis/Shelby does not have funding for transit.

Unfortunately, if Dr. Damon Fleming, the new Dean of the Fogelman College of Business, wanted to determine the source of inadequate tax revenues to address community transit needs, he would not be able to find out from UofM researchers. After the previous blog, that included an open letter to meet with Dr. Fleming, The Memphis Economy published a rather unhelpful blog in communicating the effectiveness of  Memphis/Shelby economic development efforts without any reference to peer competitors.

The UofM, The Memphis Economy project, unfortunately, has abandoned their peer city research platform which goes to support objective economic development measurement, while community economic development UofM advocacy efforts to confront local community imbalances, have been non-existent. This reality robs the community of an independent public university voice in community economic development matters.

The below charts document the source of the tax revenue shortfall with MATA funding solutions to follow. In short, had Memphis/Shelby had Nashville’s total wage growth rate combined with its tax incentive policy, Memphis/Shelby would have $187M more in annual tax revenues. While Nashville, in a boomtown is an unfair comparison for most cities, had Memphis/Shelby had Indianapolis total wage growth rate combined with its tax incentive policy, Memphis/Shelby would have $76.5M more in annual tax revenues.

Data Charts

The below chart is sourced from BLS QCEW. The low employment growth rate is due in large part to a botched disconnected workforce development system over 5 years and culturally stifled small business sector that has occurred in a closed economic development system while corporate/real estate policy interests have been prioritized.

NewJobs

Documents excessive corporate welfare culture that occurs without the benefit of local press and legislative oversight. Data sourced from EDGE, Nashville.gov and Indianapolis Business Journal with Memphis having $500M+ in job tax incentives with Nashville and Indy at $200M and $135M. At the same time, Memphis/Shelby achieved far below total wage growth of Nashville and Indianapolis while having job incentives that exceed both Nashville and Indianapolis combined by 50%. Right sizing job incentive reform would result from with 50% abatement on new capital investment only and 1% of total wages on new jobs only while maintain EDGE minimum investment and term requirements.

NewJobTaxIncent

Documents actual cost per job as realized in the local economy. Both Nashville and Indianapolis are at about $2.5K per job while Memphis/Shelby is at $14.5K.  A strict analysis would reveal a $400M job tax incentives excess.

NewJobPerJob

Funding Solutions for MATA

Its rather concerning that 3 years after funding was identified as the chief obstacle to adequate transit, none of the organizations that you would think would be concerned about the issue have proposed a funding solution. Examples of such organizations include Bus Riders Union, NAACP, NCRM, Memphis Tomorrow, Innovate Memphis, Greater Memphis Chamber, MICAH or the University of Memphis.

Here are some solutions with many of these sourced from Smart City’s recent blog. The need is $30M for adequate public transit.

Property Tax Increase – A 5% property tax increase would raise $50M and 10% $100M.

proptaxincrease

Mayor Harris – $145 Extra Vehicle Fee

Vehicle Registration Fee – $10M  There is the possibility of adding a fee to all vehicles in Shelby County. With about 700,000 vehicles, a $13 per car fee would generate the same amount of money. This is the antithesis of progressive taxation, but it would spread the pain and likely limit the political blowback. Or, the fee for each car could be staggered with an escalating scale for more cars but certainly topping out much lower than $145.

Gas Tax – Referendum $6M State law give Memphis the authority to enact its own one-cent gas tax. It would cost the average driver a moderate amount stretched over an entire year and produce as much as $6 million a year. This requires approval at referendum. While it’s not an option for county government, it’s a potential funding source.

Parking Tax– ??? Some cities, including Chicago, San Francisco, Austin, Pittsburgh, and Seattle, have taxed parking spaces based on the market rate for free parking. This not only raises more money for MATA but it could encourage more riders to use transit.

Fee on MLGW bills – ??? A fee could be added on utility bills for property owners which would be similar to the stormwater utility fee. While this could raise the amount targeted by county government, another fee on the lengthening list of fees on MLGW bills seems a volatile political option.

Adequate Facilities Taxes. Inconsistent Revenue. Over the past 20 years, these taxes have surfaced several times when county government needed revenues. It’s also known as development taxes because It’s paid on the square footage of development and is normally 50 cents to $2 per gross square foot.  These taxes are progressive since they are based on square footage. Shelby County Government abandoned previous proposals for the tax when developers howled. More to the point, development varies from year to year, so it’s impossible to depend on a specific amount.

Air BNBs – $1M

Conclusion

The imbalances are huge while the vitality to solve Memphis community problems has not materialized. Memphis is a product of corporate socialism which can only be corrected with aggressive course correction away from the dreadful FedEx/Memphis Tomorrow rigged system policy framework.

DR. FLEMING – REALLY WANT TO CONNECT TO THE COMMUNITY ?

September 8, 2019 Joe B. Kent Uncategorized

communityconnection


Dear Dr. Fleming,

If you want to connect to the community, meet with some non-establishment parts of the community like Memphis Raise Your Expectations (MRYE). You could follow the establishment meeting schedule of “community organizations” and never connect with the community. This blog will explore community disconnects which at times involve the University of Memphis and solutions.

Per Dr. Rudd’s remarks around “infusion new ideas and innovation“, a major innovative step would be to stop listening to Fred Smith and Pitt Hyde. If you met with MRYE, with authoritative data in hand, you would learn the following with solutions to follow:

  1. Since the founding of the FedEx/Memphis Tomorrow CEO organization, Memphis has persistently declined over 20 years, without an external event, while FedEx/Memphis Tomorrow initiatives feed on a community in need as their initiatives use Federal, State and Local tax dollars. Memphis Tomorrow is down in every one of their categories of public safety, workforce and economic development.
  2. Fred Smith and Pitt Hyde botched the Memphis workforce development system over 5 years while dismissing small local business solutions to address the problem while leaving 100,000 students and community in need with disconnected workforce development services costing local business and taxpayers millions. But that is what elitist do is dismiss their own people.
  3.  Of $500M, over $200M in excessive corporate/real estate job incentives have been awarded, mostly to local companies, when benchmarked against other communities in Nashville and Indianapolis as Memphis achieves far below peer average total wage growth as the establishment feeds on a community in need. See blog here for references.
  4.  Excessive incentives have been justified with bogus projection accounting, as documented in the local press in the Commercial Appeal and Daily Memphian by two separate sources.
  5.  The Fogelman College of Business and The Memphis Economy project are enablers of decline by abandoning their peer city research measurement platform soon after the publication of this blog as they pursue Carnegie I status. Lack of funding is no excuse as the update to the measurement tables only takes a couple of hours at the most. While awarding excessive incentives costing taxpayers $20M per year and using bogus accounting, the U of M’s The Memphis Economy project has been publicly silent as community imbalances are exacerbated.
  6. The University of Memphis investigative journalism partnership under the direction of Marc Perrusquia with the Daily Memphian is a complete failure as no investigative stories that question real power have been published. This may be because Pitt Hyde is a major donor to the Daily Memphian.
  7. The U of M’s and Dr. Elena Delavaga’s Annual Poverty Report basically sits on the shelf without University advocacy in public legislative chambers for policy change to address community imbalances that would help improve economic development efforts.
  8. The University of Memphis local economic development efforts seem to focus on chasing economic incentives around town for the University which is the only time you will see Ted Townsend in legislative chambers. You will not see Ted Townsend in legislative chambers lobbying for policy change to improve the social well being of people to address community imbalances which is probably the greatest local economic development challenge.
  9. In a sheltered bubble, most local leaders are ignorant of anything else other than hack elitist systems that support community decline. Its all they really know as decline has become culturally normed as only the small few benefit. Examples of ignorant but highly educated leaders include: Jim Strickland, Beverly Robertson, Brandon Morrison, Kemp Conrad and Edmund Ford Jr. as well as others just to name a few.

Solutions

DelavegaGn

The University of Memphis should not wait to be invited to connect to the community and propose solutions. As the area’s leading public higher ed institution, they should be in legislative chambers, in a genuine sense, with the people making public comment using their research findings to address the community’s #1 economic challenge, in community imbalances. Here are some suggestions:

  1. Stop listening to the hack elitist in Fred Smith and Pitt Hyde and their agents on public policy. CEOs are known to fire people for having a bad year. These guys have had a bad 20 years in the corporate community leadership space.
  2. Consider listening to local corporations like Smith and Nephew and Surface Dynamics who are investing locally without economic incentives.
  3. Encourage Elena Delavega to be in legislative chambers 2 times per month advocating for policy change to address community imbalances
  4. Have the Fogelman College of Business submit a funding proposal for adequate public transit to support economic development efforts
  5. Have the Fogelman College of Business re-establish their peer city research platform while leveraging this blog while advocating for optimal economic development policy.
  6.  Have the Fogelman College of Business submit a measurable definition for economic development that ideally focuses on improving the social well being of people.
  7.  Encourage Marc Perrusquia to conduct an investigative series on the decline of Memphis under the FedEx/Memphis Tomorrow complex.

Conclusion

Memphis is a failed experiment in elitist corporate socialism as advanced by the FedEx/Memphis Tomorrow complex. Its a complex that is largely represented on the UofM Board of Trustees.

It was disgusting to see Dr. David Rudd, on Behind the Headlines, do a touchdown dance on the 12-1 Shelby County Commission veto override of Mayor Harris, as the UofM has been rendered institutionally impotent on matters of community economic development as the state funded UofM’s economic development department chases down local incentives.

For the record, I’m not against some local incentives for the UofM. But not at the expense of becoming another cog in the wheel of the hack elitist establishment that has run the city in the ground over the last 20 years.

Memphis cannot afford to be institutionally robbed of a balancing voice of it’s leading public university in community affairs. After all there is no investigative reporting or rigorous government oversight of the vast taxpayer funded corporate community leadership complex. But sadly, in the work of community economic development, Memphis has been institutionally robbed under the new FedEx/Memphis Tomorrow UofM Board of Trustees.

Dr. Fleming, we would love to meet. Just give us a time and place.

Next Page »

Pages

  • ABOUT
  • Attribution
  • CONTACT
  • CRISIS IN SYSTEM CONFIDENCE
  • DAILY MEMPHIAN: Actively Censoring Free Speech
  • DATA: For Shelby County Macroeconomic Analysis
  • DEFICIENT ECONOMIC DEVELOPMENT – TAXPAYER LOSS
  • Economic Development Growth Engine (EDGE)
    • EDGE Public Comment – 06/20/18
  • EDGE Retention PILOT Program (A Memphis Tomorrow Bi-Product)
    • Existing and Additional Facility Capital Investment (3)
    • Existing Facility Retention PILOT Capital Investment (7)
    • Local Facility Relocation (3)
    • New and Existing Facility Capital Investment (1)
    • New Facility and Consolidation from West Memphis (2)
    • New Facility Capital Investment (2)
  • Educational Attainment Requirements by Geography
  • Greater Memphis Alliance for Competitive Workforce (GMACW)
  • Implement
  • IT’S WEIRD
  • Median Age vs Memphis Peers
  • Memphis Chamber of Commerce
  • Memphis Raise Your Expectations (MRYE) Economic Development #BalanceMemphis
  • Memphis Tomorrow Executive Committee – $124M in taxpayer shortfalls
  • MRYE Memphis Economic Development Survey
  • MWBE DASHBOARD
  • PUBLIC PARKING PORN
  • RESOURCES
    • Memphis City Council Attempted Comment Not Heard – 06/19/18
  • SOLUTION
  • What Does $124M Look Like in Community Benefit ?
  • WORKFORCE: Lost Decade

Archives

  • November 2024
  • April 2022
  • February 2022
  • January 2022
  • December 2021
  • November 2021
  • October 2021
  • September 2021
  • August 2021
  • July 2021
  • June 2021
  • May 2021
  • April 2021
  • March 2021
  • February 2021
  • January 2021
  • December 2020
  • November 2020
  • October 2020
  • September 2020
  • August 2020
  • July 2020
  • June 2020
  • May 2020
  • April 2020
  • March 2020
  • February 2020
  • January 2020
  • December 2019
  • November 2019
  • October 2019
  • September 2019
  • August 2019
  • July 2019
  • June 2019
  • May 2019
  • April 2019
  • March 2019
  • February 2019
  • January 2019
  • December 2018
  • November 2018
  • October 2018
  • September 2018
  • August 2018
  • July 2018
  • June 2018

Categories

  • Chamber Alliance (1)
  • City Council (4)
  • County Commission (3)
  • Economic Development (1)
  • EDGE (2)
  • Memphis Tomorrow (2)
  • Public Comment (7)
  • Strip (1)
  • Uncategorized (271)

WordPress

  • Log in
  • WordPress

Subscribe

  • Entries (RSS)
  • Comments (RSS)

Pages

  • ABOUT
  • Attribution
  • CONTACT
  • CRISIS IN SYSTEM CONFIDENCE
  • DAILY MEMPHIAN: Actively Censoring Free Speech
  • DATA: For Shelby County Macroeconomic Analysis
  • DEFICIENT ECONOMIC DEVELOPMENT – TAXPAYER LOSS
  • Economic Development Growth Engine (EDGE)
    • EDGE Public Comment – 06/20/18
  • EDGE Retention PILOT Program (A Memphis Tomorrow Bi-Product)
    • Existing and Additional Facility Capital Investment (3)
    • Existing Facility Retention PILOT Capital Investment (7)
    • Local Facility Relocation (3)
    • New and Existing Facility Capital Investment (1)
    • New Facility and Consolidation from West Memphis (2)
    • New Facility Capital Investment (2)
  • Educational Attainment Requirements by Geography
  • Greater Memphis Alliance for Competitive Workforce (GMACW)
  • Implement
  • IT’S WEIRD
  • Median Age vs Memphis Peers
  • Memphis Chamber of Commerce
  • Memphis Raise Your Expectations (MRYE) Economic Development #BalanceMemphis
  • Memphis Tomorrow Executive Committee – $124M in taxpayer shortfalls
  • MRYE Memphis Economic Development Survey
  • MWBE DASHBOARD
  • PUBLIC PARKING PORN
  • RESOURCES
    • Memphis City Council Attempted Comment Not Heard – 06/19/18
  • SOLUTION
  • What Does $124M Look Like in Community Benefit ?
  • WORKFORCE: Lost Decade

Archives

  • November 2024
  • April 2022
  • February 2022
  • January 2022
  • December 2021
  • November 2021
  • October 2021
  • September 2021
  • August 2021
  • July 2021
  • June 2021
  • May 2021
  • April 2021
  • March 2021
  • February 2021
  • January 2021
  • December 2020
  • November 2020
  • October 2020
  • September 2020
  • August 2020
  • July 2020
  • June 2020
  • May 2020
  • April 2020
  • March 2020
  • February 2020
  • January 2020
  • December 2019
  • November 2019
  • October 2019
  • September 2019
  • August 2019
  • July 2019
  • June 2019
  • May 2019
  • April 2019
  • March 2019
  • February 2019
  • January 2019
  • December 2018
  • November 2018
  • October 2018
  • September 2018
  • August 2018
  • July 2018
  • June 2018

Categories

  • Chamber Alliance (1)
  • City Council (4)
  • County Commission (3)
  • Economic Development (1)
  • EDGE (2)
  • Memphis Tomorrow (2)
  • Public Comment (7)
  • Strip (1)
  • Uncategorized (271)

WordPress

  • Log in
  • WordPress

CyberChimps WordPress Themes

© MCCL