Memphis Corporate Community Leadership Measured

  • ABOUT
  • MWBE
  • SOLUTION
  • IT’S WEIRD
  • RESOURCES
  • CONTACT
  • MRYE

MEASUREMENT AS A SOLUTION: Recalibrating Economic Development Toward Workforce

November 26, 2019 Joe B. Kent Uncategorized

Let’s say that Commissioners Michael Whaley and Brandon Morrison wanted to direct a finite set of economic development resources more toward workforce development. Would they have the data to make the business case?

For some time now, expensive economic development programming, primarily in the form of corporate/real estate incentives, have exploded in Memphis without reliable measurement all while local workforce development efforts have floundered. One reason for this is the lack of publicly administered measurement and a data driven business case for workforce development.

Over the past 8 years, floundering workforce development efforts have persisted in the midst of faulty business cases made using unreliable economic impact studies that forecast massive tax revenue windfalls in favor of corporate/real estate incentives. 

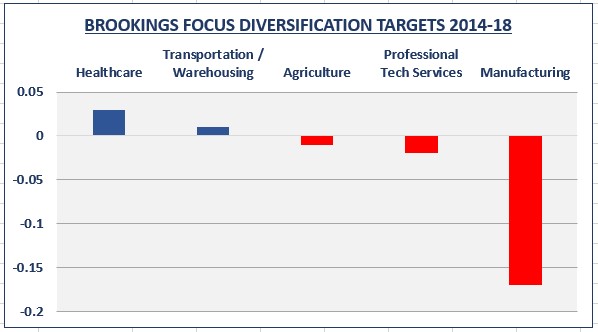
The result, flat local tax revenues with connected workforce development implementation five years behind schedule. This is troubling, just as a recent Smart City Memphis posted  Brookings Report states that over 95% of surveyed executives rated the availability of skilled labor as “very important” or “important” in site selection. The report further signals an economic development disconnect with only about 2% in economic development incentives nationally going toward job training.

So does the County, Whaley and Morrison have the measurement tools to make the business case for more resources directed toward workforce in local economic development efforts? Not at the moment. After all, County Trustee Lenoir and now Newman have repeatedly called for an integrated database just to manage tax incentives of 9 abating boards and then there is the question of reliable economic and fiscal impact measurement of incentives of which there is none. There has to be a better way…..

Tax Incentive Fiscal Note Impact (TIFNI) Platform

There is a better way. While leveraging local data, TIFNI is a proposed LOSB research project to deploy a data driven methodology to size public economic/workforce development incentives and expenditures based on customer taxpayer return on investment (ROI) analysis while deploying an integrated tax incentive database. Just like a community does not want to go over board with corporate/real estate incentives, they do not want to rush and overspend with workforce development either. 

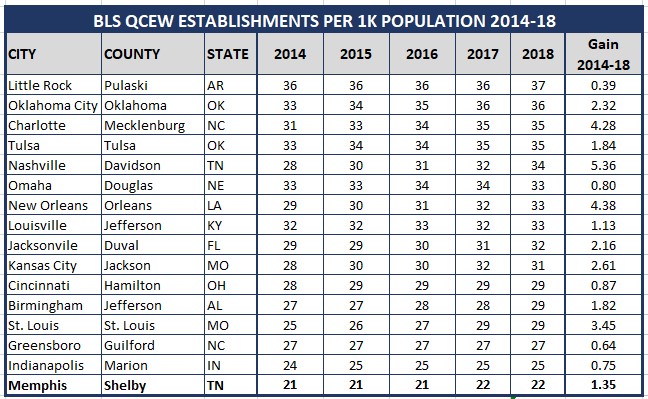
So what’s the right amount ? While its undetermined, with a Memphis youthful population asset advantage over peer economic development competitors, TIFNI would likely recommend directing more financial resources toward workforce development to increase wages and improve economic development outcomes. In the end, the only true economic development in Memphis is going to happen by increasing wages of the resident population or through new residents that make above average wages. New residents making below average wages, isn’t going to move the needle.

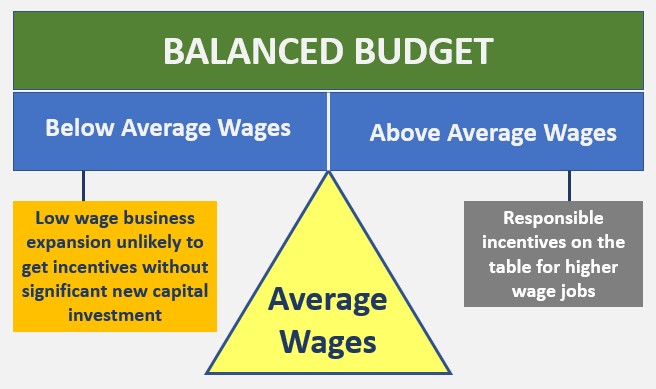
At the same time, the community can’t underspend on business development expansion or overspend at the cost of workforce development within the context of economic development and a global economy. A simple organizing framework can be found in the diagram below when implementing reliable economic and fiscal impact analysis regarding business expansion incentives.

The budget is balanced with average wages. So, business expansion with below average wages is unlikely to receive tax incentives absent significant capital investment. And if they do receive incentives in this model they will likely be below 75% for new capital investment when employing below average wage jobs. Likewise, in the current economic development environment, properly measured incentives are in order when considering business expansions that pay above average wages. See diagram below. 

To that extent, TIFNI can be applied to optimize workforce development ROI as well within the context of economic development. 

Conclusion

Publicly administered reliable economic and fiscal impact analysis with key performance indicator measurement is needed to serve economic development efforts for the benefit of the Shelby County taxpayers. The LOSB TIFNI solution provides just that. Without needed measurement, Whaley and Morrison are likely to only be workforce activists unequipped with a data driven business case to optimize customer taxpayer ROI for local economic and workforce development efforts….. 

WHERE IS MEMPHIS INDUSTRIAL MOMENTUM ?

November 16, 2019 Joe B. Kent Uncategorized

Memphis industrial momentum can be found in the Bureau of Labor and Statistics (BLS) sector of “management of enterprises”. Since the 2014 Brookings FOCUS Memphis-Shelby County Regional Economic Development plan release, average wages have increased by 30% (peer avg 10%) and total wages have increased by 90% (peer avg 20%) in the plan untargeted management of enterprises sector.

The sector pays an average wage of above $100K and has a low economic multiplier to fuel community economic growth. Shelby County significantly leads all of its 16 member peer group in percentage total wage growth of this industry sector. See table above.

The management of enterprises sector hosts wealth management holding companies which in many cases house the real estate LLCs that benefit from tax incentives. To increase economic resiliency, Brookings FOCUS targeted diversification of wage concentration away from the heavily concentrated transportation sector with growth targets residing in healthcare, professional technical services, agriculture and manufacturing sectors.

The unplanned growth in management of enterprises reveals that significant wage growth concentrated in high wage jobs that needed wage growth the least as measured by location quotient. Location quotient, in this case, compares total wage concentration of an industry sector to locations throughout the United States. Shelby County led its 16 member peer group with 69% total wage concentration growth (peer avg 5%) in management of enterprises. This growth happens to coincide with the acceleration of liberal tax incentives that occurred under the 2014 Brookings FOCUS plan.  

Good news in the below chart shows that transportation, a dominant sector employer, had 13% growth in average wages and healthcare achieved peer average growth from 2014-18. Bad news is that targeted sectors for wage concentration growth in professional technical services, agriculture and manufacturing all declined as did average wages in the respective sectors.

Most concerning is the 17% wage concentration decline in manufacturing (+1.3% peer avg) occurring as local workforce development efforts were dismissed. This occurred as Shelby County average wages exploded upward for high wage jobs in the untargeted management of enterprises sector from $109K to $142K under the unmeasured Brookings FOCUS plan. See chart below:

Workforce Development – Tulsa and Away from Nashville Comparisons

About the time the Brookings FOCUS “vision” economic development plan was released in 2014, Shelby County peer, Tulsa and not Nashville in this comparative case, was releasing a detailed workforce development “implementation” plan. The plan focused on occupations that served the energy, manufacturing, construction, healthcare, professional technical and transportation logistics industries. 

Did workforce development implementation work as an economic development strategy for Tulsa ? Overall, yes it did.

From 2014-18, Tulsa led the 16 member Shelby County peer group in both postsecondary completions with a 33% increase and increased wage concentration in manufacturing with a 21% increase. That translated into increasing total wage concentration, as expressed through location quotient (LQ), in targeted sectors and jobs with increasing wages. Professional technical industry wage concentration goal increases did not materialize for Tulsa and transportation goals were not met but appears to have been in part as a result of decreasing average wages in the sector. See below Tulsa results:

Having a measurable workforce development implementation plan worked to increase Tulsa postsecondary completion awards and to increase wage concentration in targeted economic development growth sectors. 

Recommendations

The following recommendations can be made based on the above:

Get away from excessive untargeted tax incentives. They don’t work as an economic development strategy while making the community less attractive for economic investment

Have a measurable economic development implementation plan with the taxpayer as the customer which aggressively targets manufacturing, professional tech services, agriculture and locally owned small business development

Have a measurable workforce development implementation plan

Prioritize responsible, properly measured and accounted for tax incentives for target industries.

Implementation of these recommendations will help to target and accelerate local economic development efforts while discontinuing practices that have not worked with increasing wages and the customer taxpayer in mind…. 

WHERE IS MEMPHIS INDUSTRIAL MOMENTUM ?

November 16, 2019 Joe B. Kent Uncategorized

Memphis industrial momentum is in the Bureau of Labor and Statistics (BLS) sector of Management of Enterprises. Since the 2014 release of the Brookings FOCUS economic development plan, wage concentration in Shelby County has increased 69% in the untargeted sector that pays above $100K average wages.

Brookings FOCUS targeted transportation and warehousing for decrease and agriculture, healthcare, professional technical services and manufacturing for increase. About the time that the Brookings FOCUS economic development “vision” plan was released, Tulsa, a peer city, was releasing its workforce development “implementation” plan. It worked. Tulsa increased

Since 2014, Shelby County wages in the high wage management of enterprises sector increased by 30% from $109K to $142K. Total wages paid in the sector increased by 90%. from $660M to $1.26B. The sector houses holding companies which are of the type that would host many of the real estate LLCs that benefit from tax incentives. Brookings FOCUS targeted transportation and warehousing for decrease and agriculture, healthcare, professional technical services and manufacturing for increase. But Brookings FOCUS has gone unmeasured with wage concentration growth in targeted sectors not materializing

LOSB SOLUTION: Shelby County Government Owned Economic Development KPIs

November 10, 2019 Joe B. Kent Uncategorized

KPI

Key performance indicators (KPIs) funded and owned by Shelby County Government are needed for economic and workforce development measurement. Shelby County expenditures in these mission critical areas exceed $500M per year, yet there are no county owned KPIs to inform economic and workforce development oversight and policy work. The development of KPIs, which would also include a tax incentive fiscal note impact (TIFNI) platform for measuring (ROI) on tax incentives, could potentially be funded with $1.7M in misappropriated EDGE/Depot funds that should come back to taxpayers. This is an issue that has unfortunately gone locally unreported.

Federal and State government fund source their own KPIs, why shouldn’t Shelby County Government ?

Reliable KPI customer taxpayer centric measurement efforts have not been implemented or sustained by multiple organizations external to Shelby County government leaving policymakers and the customer taxpayer in the dark regarding hefty taxpayer funded expenditures. Perhaps the reason for this KPI unsustainability of outside organizations regarding taxpayer funds is because the vested interest is not there in measuring the effectiveness of funds outside of their organization.

And reliable measurement concerns regarding the Economic Development Growth Engine (EDGE) Scorecard methodology related to inflated tax revenue projections involving $500M+ in job tax incentives, have been regularly questioned in public proceedings, in the Daily Memphian and by The Beacon Center of Tennessee.  

Exploring EDGE Incentive Accounting

With tax incentives having been the primary Memphis/Shelby economic development tool and inflated projection accounting concerns going back 8 years, KPIs would correct EDGE tax incentive projection accounting concerns with complete accounting and a fiscal note for all agency abatements in a single centralized tax incentive repository as requested by the Trustee’s office. This action would enable pubic return on investment (ROI) analysis for tax incentives while providing insight for optimizing economic and workforce development investments in the digital educonomy.

For example, on this upcoming quarterly EDGE report to the Shelby County Commission, FR8 Zone and Cherry Tree tax incentive projects collectively claim $3.5M in projected tax revenue against $3.75M in tax abatement incentives. At the same time, there is $942K combined on both projects that inflate projected tax revenue by claiming existing property tax revenue as new project revenue. This finding adjusts revenue down from $3.5M to $2.6M against $3.75M in abatements resulting in a $1.15M taxpayer loss while recruiting low wage logistics warehousing jobs.

Further, there is another low wage warehouse project on the EDGE agenda for this week in LeSaint Logistics. The LeSaint Logistics project also overstates project revenue by $1.5M by claiming existing property tax revenue as project revenue. This reduces revenue from $4M to $2.5M against a tax abatement of $5.5M resulting in a taxpayer loss of $3M.

Concerning, the above EDGE incentives result in $4.15M in taxpayer losses to incent low wage warehousing jobs. These are the very type of logistics jobs that the 2014 Brookings Focus Memphis Economic Development plan set goals from which to diversify away. But Brookings FOCUS KPI measurement efforts were never implemented thereby keeping the door open for taxpayer losing incentives, like the ones above, for low wage warehousing jobs.

Overall, concerns of excessive incentives are routinely publicly voiced with the persistent winners being corporate/real estate interests while property tax revenues remain flat in the face of EDGE inflated tax revenue projections, lagging small business vitality and workforce development outcomes. Small business and workforce are the primary drivers of any local economy.

The above microanalysis of individual incentive awards (FR8, Cherry Tree and LeSaint) supports part of the flawed incremental methodology that has caused local job incentive awards to grow so large over time, not to mention the retention tax incentive accounting concerns confronted by the Beacon Center of Tennessee. The chart below, which has been published before, shows the per job cost of EDGE tax incentives when compared to peer cities Nashville and Indianapolis while pointing to an overall local $200-400M excess, when compared to other cities. These excesses accelerated under the Brookings FOCUS Plan where KPIs were not sustained.

NewJobPerJob

And then there is the OaksEdge high end senior living residential PILOT on the agenda this week for a $22M tax incentive which is $22M more than would be awarded in any other County in Tennessee. Besides, the residential PILOT was designed to support infill development to attract Millennials to Memphis. But this is a whole other excessive PILOT story that involves the irresponsible expansion of the original intent of residential PILOTs which is arguably already a fiscally liberal provision exclusively allowed for Shelby County in the State of Tennessee. So back to the Brookings FOCUS economic development plan and KPIs.

Brookings FOCUS Plan

The Brookings FOCUS Economic Development plan was a public-private partnership planning effort and product of the Memphis and Shelby County Regional Economic Development Plan Steering Committee Co-Chaired by former Mayor A.C. Wharton, Shelby County Mayor Mark Luttrell and Christine Richards, formerly Chief Counsel for FedEx. The planning project was managed by the Economic Development Growth Engine (EDGE) and the steering committee consisted of representatives from education, industry and local government.

The 2014 Brookings FOCUS plan set out to 1) diversify away from logistics, 2) improve workforce through increased educational attainment, 3) increase support for entrepreneurs, startups and small business and 4) increase employment density in the urban core. Given these key findings, KPIs can be applied to measure the effectiveness of the Bookings FOCUS plan and taxpayer funded economic development efforts.

Per the Brookings FOCUS plan, as an example of a KPI for diversifying away from and decreasing transportation logistics low wage warehousing jobs with a focus on increasing healthcare, agriculture, professional tech services and manufacturing, a KPI can be deployed. This KPI uses Bureau of Labor and Statistics (BLS) data to measure industrial wage concentration changes in Shelby County as compared to the nation since 2014. Healthcare was the only improvement for Shelby County while Transportation targeted for decrease, increased and agriculture, professional tech services and manufacturing targets for increase, all decreased. Most concerning, was the significant fall in manufacturing industrial wage concentration.

BrookingsFocus3

As expressed through the below KPI, challenging all local industrial sectors for growth is an unprepared workforce with below peer average postsecondary educational attainment and program completion. The below shows how Shelby County postsecondary educational attainment, across all ward levels, compares vs 15 Shelby County peers. In short, Memphis/Shelby needs to increase postsecondary completions by 6,000 per year while promoting in demand career pathways, with digital technology in mind to serve all industrial sectors.

ShelbyComplRates

Shelby County Recommended KPIs

Federal and State government fund source and own their KPIs. Why shouldn’t Shelby County Government ? After all, there appears to be a local $1.7M funding source and external to Shelby County Government, local organizations have not executed in the KPI area. Besides, such organizations often lack a vested interest and have an agenda that is not in direct alignment with customer taxpayers. While the potential number of KPIs are endless, these are a few simple recommended KPIs for economic and workforce development measurement using authoritative Federal, State and Local government data sources:

  • Centralized Tax Incentive Database for all Agencies with Fiscal Note Support
  • Average Wages
  • Total Wages
  • Total Employment
  • Unemployment rate
  • Business Establishments per 1k Population
  • Postsecondary Educational Attainment by Award Level and Career Cluster
  • Industrial Employment and Diversification

In fact, deploying fewer simple but highly impactful KPIs that the County owns and maintains is probably best. A few simple KPIs will get the County started, with more to come. The KPIs will equip policymakers with the needed customer taxpayer aligned data, owned, funded and maintained by the County to inform public oversight and economic/workforce policy development.


LOSB SOLUTION: Measuring the Brookings FOCUS Economic Development Plan

November 5, 2019 Joe B. Kent Uncategorized

focus

FOCUS – A Roadmap For Transforming The Metro Memphis Economy is the prevailing economic development plan in Memphis. The 2014 plan is the product of the Memphis and Shelby County Regional Economic Development Plan Steering Committee Co-Chaired by former Mayor A.C. Wharton, Shelby County Mayor Mark Luttrell and Christine Richards, formerly Chief Counsel for FedEx. The planning project was managed by the Economic Development Growth Engine (EDGE) and the steering committee consisted of representatives from education, industry and local government.The executive summary of the plan states:

“Focus: A Roadmap for Transforming the Metro Memphis Economy will reestablish its steering committee under the umbrella of Memphis Fast Forward, adding more industry leaders and representation from diverse stakeholders to guide implementation. In coordinating action with key partners to ensure alignment, leadership will establish performance metrics, track progress, and hold partners accountable as implementation moves forward. It will build ongoing capacity for market analysis, identifying opportunities and prioritizing next steps.“

With the former stated, it does not appear that metrics or progress monitoring was ever established. Brookings FOCUS is never publicly discussed nor does it ever appear on local legislative agendas. At the same time, local government is spending over $60M per year on economic development without any defined economic development metrics or progress monitoring. So how can Brookings FOCUS be measured ?

Brookings FOCUS did lay out key findings in four challenged areas. Those findings are: 1) economic diversification away from logistics, 2) improving workforce through increased educational attainment, 3) increase support for entrpreneurs, startups and small business and 4) increase employment density in the urban core. Given these key findings, metrics can be applied to measure the effectiveness of the Bookings FOCUS plan.

Diversification Away From Logistics

The Bureau of Labor and Statistics (BLS) Quarterly Census of Employment Wages (QCEW) program can be used to measure industrial diversification using location quotients (LQ). LQs measure the concentration of a variable, in this case industrial wages, as compared to the nation. The Brookings FOCUS plan discusses remaining the national leader in logistics but diversifying the economy away from logistics.

The plan also mentions target sectors for growth which include biologistics, biotechnology, medical devices and agriculture. Using LQ, industrial diversification through total wages paid can be measured since 2014 using 2018 industrial wage data. Target areas mentioned are in red as found in the table below. Healthcare LQ from which some of the planned target economic activity would take place, grew in LQ by .03 while other target areas decreased in agriculture by .01, professional and technical services by .02 and most concerning manufacturing by .17.

As far as the industry target goal for LQ decrease in transportation logistics, it actually increased by .01. See the below table for all industries:

Focusblsindustry2

Economic diversification efforts could better be served by more public measurement and progress monitoring.

Workforce – Educational Attainment

Educational attainment can be measured using data from Integrated Postsecondary Education Data System (IPEDS). Using IPEDS, educational attainment levels can be compared to peer city competitors. To adjust for population variances between 15 peer counties, a population factor can be applied to peer economic competetitors actual postecondary completions. In this way, actual completers in a larger county such as Charlotte Mecklenburg County are reduced whereas program completions for a smaller geography such as Little Rock Pulaski County are increased.

Given this methodology, average prorated for population postsecondary completions for occupational clusters can be derived. Benchmarked from 2015, the below table shows the Shelby County gap from the prorated occupational cluster peer average. The column on the far right shows the average gap closure across 2016, 2017 and 2018. The 2014 Brookings FOCUS plan states:

In the first phase of implementation, the region will strengthen its workforce development system to prepare more workers for next economy jobs. The Greater Memphis Alliance for a Competitive Workforce will leverage new state programs that expand access to community colleges and training and strengthen alignment with regional employers and real-world skill requirements.

Using IPEDS data, the below table data shows the Shelby County progress of increasing postsecondary completions from 2014. A negative number reflects below prorate peer average completions. Bright spots in completion rates can be found in Health Science where the average gap closure across 3 years was 121 and Law, Public Safety, Corrections and Security at 67.

At the same time, in demand occupational clusters of Transportation average gap across 3 years increased by 16, Agriculture by 22, Manufacturing by 48, Information Technology by 117 and Architecture/Construction by 124.

Overall, the prorated postsecondary completion gap from 2015-18 increased by an average of 415 for all occupational clusters. Postsecondary completions overall, need to increase by approximately 7,500 per year to achieve peer average postsecondary completions.

FocusIPEDS2

Workforce development efforts could better be served by more informed public measurement and regular progress monitoring.

Increase Support for Entrepreneurs, Startups and Small Business

Since most businesses are small business, the best measure for small business vitality is BLS QCEW establishments. Using BLS QCEW data, the number of business establishments per 1K population can be derived. Memphis ranks last among 15 peers in the number of establishments per 1K population. The gain since the release of the Brookings FOCUS plan can be found in the far right column.

The average 2014-18 gain for business establishments per 1K population was 2.13. The Shelby County gain from 2014-18 was 1.35 per 1K population. Additionally, on the legislative public record concerns can be found related to the lack of support for locally owned small businesses (LOSBs). Based on the data, there appears to be a lack of establishment cultural support for LOSBs. See below table data:

focusSmbiz2

Small business can best be supported by first increasing the transactional velocity with LOSBs while secondarily supplementing small business development with business planning advice and collaborative space. Further small business development efforts could better be served by more informed public measurement and regular progress monitoring.

Increase Employment Density In The Urban Core

Based on the data, the primary tool for increasing employment has been tax incentives based on the Northern Mississippi threat with less focus on workforce and small business development. Employment gains have been locally thwarted by unprepared workforce and public transit. The Brookings FOCUS plan states:

Tax advantages and aggressive incentive packages in northern Mississippi have accelerated the outward growth pattern, luring firms to relocate within the region and increasing both segregation and disinvestment in older areas.

Given the above, the effectiveness of Brookings FOCUS and local tax incentives can best be measured using BLS QCEW employment percentage gain and actual job increase data while benchmarking overall EDGE job incentives versus peer competitors.

Shelby County employment gains from 2014 to 2018 trail the peer average by approximately 1% or 5K filled jobs. Shelby County employment growth from 2014-18 was 4.83% compared to the peer average at 5.75%. And since EDGE began, employment growth trails the peer average by 4.4% or 20K filled jobs. At the same time, local job incentives are some $500M+ since 2011 while using incomplete accounting which has been externally questioned by The Beacon Center of Tennessee.

Based on this information, tax incentives can be benchmarked against 2 peer cities in Nashville and Indianapolis to show that Memphis/Shelby is paying about $14K per filled job in incentives versus Nashville and Indianapolis at approximately $2.5K per job. This results in $200-400M in excess job tax incentives which take away from investments that support workforce and small business and are the primary driver of any local economy.

NewJobPerJob

Conclusion

Economic development efforts can better be served by more informed public measurement and regular progress monitoring.

A HIGHER COMMUNITY STANDARD FOR THE UofM

November 1, 2019 Joe B. Kent Uncategorized

HarrisUofM

The highest standard should be applied to a community’s leading public university. And in Memphis, that is The University of Memphis (U of M) as Shelby County Mayor Lee Harris leads a local economic development conversation focusing on increasing wages to improve local citizenry social well being.

In ANY city that struggles with high poverty levels, it’s reasonable for a local Mayor to reach out to its leading public university to help set the standard for improved economic development outcomes through increased wages and improved policy. But thus far, in the bubble of Memphis. the UofM has been unwilling to commit to a time frame for raising its minimum employee wage to $15 per hour.

Memphis needs help from its leading public university in the UofM in setting the example of improving economic development outcomes through increased wages while battling high poverty rates. With the UofM currently unwilling to commit to a time frame for increasing wages, the Harris administration is advocating for a contractual clause pertaining to the $1M County funded pool project that would bind the UofM to a time frame for increasing minimum wages to $15 per hour.

Some, like Commission Chairman Mark Billingsley have raised legitimate concerns regarding setting a new contractual precedent in treating the UofM differently. At the same time, Billingsley’s employer, Christian Brothers University announced a firm schedule for increasing wages to $15 per hour thereby setting a new local leadership standard for increasing wages.

No Precedent – The UofM is Different

Billingsley

In the recent County Commission discussion, questions were raised like “If we treat the UofM contractually differently are we going to treat MIFA and nonprofits differently when it comes to their contracts ?” or “Will this set a precedent in how we treat the UofM and require us to treat our vendors differently ? “.

There is no precedent here for nonprofits and vendors regarding contract consideration. The UofM is different from the former which provides a clear pathway for a unique contractual clause that would state a time frame for raising minimum employee wages to $15 per hour at the UofM. So how is the UofM different ?

The UofM is the only formula funded public entity actively participating in tax incentives while receiving local discretionary funding consideration. See below local projects awarded since 2016:

  • The Highland TIF – $21M (Awarded)
  • Pool Renovation Project – $1M (Awarded)
  • 2 residential PILOTs that that did not meet minimum EDGE requirements – $1.2M (Awarded)
  • A new tennis center – $3M (Awarded)
  •  Park Avenue TIF (Forthcoming)

Grand Total: $26M in awards with more scheduled

As shown the public is going over and above to support the University of Memphis. But is the UofM reciprocating ?

A Higher Standard for The UofM

A higher standard in the local of work of community and economic development is needed for the UofM. The UofM will never reach their potential as a university or thought leader unless they independently become a transformational force in setting the local standard in confronting staggering poverty levels in their own community while improving community and economic development outcomes.

The UofM could have helped to expedite lagging connected workforce development efforts or they could have sustained credible economic development measurement platforms that included peer comparisons or they could have conducted a more credible economic outlook survey or their investigative journalism efforts could have more aggressively questioned the local establishment on lagging economic development outcomes or they could have set a firm timetable for raising minimum wages to $15 per hour but the UofM didn’t. All of the former helps to bolster the work of economic development for the resident population and the UofM as a transformational university thought leader.

Generally, one of the worst outcomes for any university is to surrender their thought leadership to the local establishment leaving a community without needed system checks. This seems to have happened with the UofM on the local community and economic development front under the new local UofM Board of Trustees. At least before, in 2015, the UofM seemed to have felt free to exercise thought leadership while questioning the local establishment in this report from the University of Memphis Planning Department. But that does not seem to be the case today.

Conclusion

In a Memphis community with staggering poverty levels, the community needs a University of Memphis that sets the standard in confronting poverty while independently advocating on the front lines for more thoughtful and research based economic development policy. Without it, both Memphis and the UofM loses.

Pages

  • ABOUT
  • Attribution
  • CONTACT
  • CRISIS IN SYSTEM CONFIDENCE
  • DAILY MEMPHIAN: Actively Censoring Free Speech
  • DATA: For Shelby County Macroeconomic Analysis
  • DEFICIENT ECONOMIC DEVELOPMENT – TAXPAYER LOSS
  • Economic Development Growth Engine (EDGE)
    • EDGE Public Comment – 06/20/18
  • EDGE Retention PILOT Program (A Memphis Tomorrow Bi-Product)
    • Existing and Additional Facility Capital Investment (3)
    • Existing Facility Retention PILOT Capital Investment (7)
    • Local Facility Relocation (3)
    • New and Existing Facility Capital Investment (1)
    • New Facility and Consolidation from West Memphis (2)
    • New Facility Capital Investment (2)
  • Educational Attainment Requirements by Geography
  • Greater Memphis Alliance for Competitive Workforce (GMACW)
  • Implement
  • IT’S WEIRD
  • Median Age vs Memphis Peers
  • Memphis Chamber of Commerce
  • Memphis Raise Your Expectations (MRYE) Economic Development #BalanceMemphis
  • Memphis Tomorrow Executive Committee – $124M in taxpayer shortfalls
  • MRYE Memphis Economic Development Survey
  • MWBE DASHBOARD
  • PUBLIC PARKING PORN
  • RESOURCES
    • Memphis City Council Attempted Comment Not Heard – 06/19/18
  • SOLUTION
  • What Does $124M Look Like in Community Benefit ?
  • WORKFORCE: Lost Decade

Archives

  • April 2022
  • February 2022
  • January 2022
  • December 2021
  • November 2021
  • October 2021
  • September 2021
  • August 2021
  • July 2021
  • June 2021
  • May 2021
  • April 2021
  • March 2021
  • February 2021
  • January 2021
  • December 2020
  • November 2020
  • October 2020
  • September 2020
  • August 2020
  • July 2020
  • June 2020
  • May 2020
  • April 2020
  • March 2020
  • February 2020
  • January 2020
  • December 2019
  • November 2019
  • October 2019
  • September 2019
  • August 2019
  • July 2019
  • June 2019
  • May 2019
  • April 2019
  • March 2019
  • February 2019
  • January 2019
  • December 2018
  • November 2018
  • October 2018
  • September 2018
  • August 2018
  • July 2018
  • June 2018

Categories

  • Chamber Alliance (1)
  • City Council (4)
  • County Commission (3)
  • Economic Development (1)
  • EDGE (2)
  • Memphis Tomorrow (2)
  • Public Comment (7)
  • Strip (1)
  • Uncategorized (269)

WordPress

  • Log in
  • WordPress

Subscribe

  • Entries (RSS)
  • Comments (RSS)

Pages

  • ABOUT
  • Attribution
  • CONTACT
  • CRISIS IN SYSTEM CONFIDENCE
  • DAILY MEMPHIAN: Actively Censoring Free Speech
  • DATA: For Shelby County Macroeconomic Analysis
  • DEFICIENT ECONOMIC DEVELOPMENT – TAXPAYER LOSS
  • Economic Development Growth Engine (EDGE)
    • EDGE Public Comment – 06/20/18
  • EDGE Retention PILOT Program (A Memphis Tomorrow Bi-Product)
    • Existing and Additional Facility Capital Investment (3)
    • Existing Facility Retention PILOT Capital Investment (7)
    • Local Facility Relocation (3)
    • New and Existing Facility Capital Investment (1)
    • New Facility and Consolidation from West Memphis (2)
    • New Facility Capital Investment (2)
  • Educational Attainment Requirements by Geography
  • Greater Memphis Alliance for Competitive Workforce (GMACW)
  • Implement
  • IT’S WEIRD
  • Median Age vs Memphis Peers
  • Memphis Chamber of Commerce
  • Memphis Raise Your Expectations (MRYE) Economic Development #BalanceMemphis
  • Memphis Tomorrow Executive Committee – $124M in taxpayer shortfalls
  • MRYE Memphis Economic Development Survey
  • MWBE DASHBOARD
  • PUBLIC PARKING PORN
  • RESOURCES
    • Memphis City Council Attempted Comment Not Heard – 06/19/18
  • SOLUTION
  • What Does $124M Look Like in Community Benefit ?
  • WORKFORCE: Lost Decade

Archives

  • April 2022
  • February 2022
  • January 2022
  • December 2021
  • November 2021
  • October 2021
  • September 2021
  • August 2021
  • July 2021
  • June 2021
  • May 2021
  • April 2021
  • March 2021
  • February 2021
  • January 2021
  • December 2020
  • November 2020
  • October 2020
  • September 2020
  • August 2020
  • July 2020
  • June 2020
  • May 2020
  • April 2020
  • March 2020
  • February 2020
  • January 2020
  • December 2019
  • November 2019
  • October 2019
  • September 2019
  • August 2019
  • July 2019
  • June 2019
  • May 2019
  • April 2019
  • March 2019
  • February 2019
  • January 2019
  • December 2018
  • November 2018
  • October 2018
  • September 2018
  • August 2018
  • July 2018
  • June 2018

Categories

  • Chamber Alliance (1)
  • City Council (4)
  • County Commission (3)
  • Economic Development (1)
  • EDGE (2)
  • Memphis Tomorrow (2)
  • Public Comment (7)
  • Strip (1)
  • Uncategorized (269)

WordPress

  • Log in
  • WordPress

CyberChimps WordPress Themes

© MCCL