Memphis Corporate Community Leadership Measured

  • ABOUT
  • MWBE
  • SOLUTION
  • IT’S WEIRD
  • RESOURCES
  • CONTACT
  • MRYE

COMPLETE FAILURE: SCORE Gets F

August 31, 2021 Joe B. Kent Uncategorized

It seems  the promise land for every retiring elitist politician is to find an unaccountable nonprofit post. That’s what Bill Frist did, becoming Board Chairman of the State Collaborative on Reforming Education (SCORE).

SCORE behaves much like a vendor lobby as opposed to a leader in educational policy and innovation. As an example, in 2021, the General Assembly obstructed testimony from local educators on SCORE’s Read 360 initiative. This is hard to explain, as these are the very educators that will be required to implement the initiative. 

So with that 2021 backdrop, in 2009, with $500M in Race to The Top funds to follow, Frist wrote SCORE’s Roadmap to Success. The plan goal was to make Tennessee Schools #1 in the Southeast in 5 years. So after 10 years, how are we doin ?

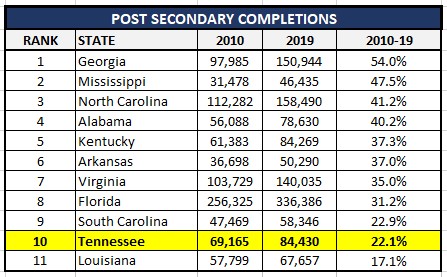
Under Frist, SCORE is a complete failure. Using data from the Integrated Post-Secondary Education Data System (IPEDS), Tennessee ranks #10 out of 11 Southeast states in post-secondary completion percentage increases since 2010. This is what happens, when an organization like SCORE, effectively teams with elitists and General Assembly members from the State’s largest Shelby County to botch the workforce development system. 

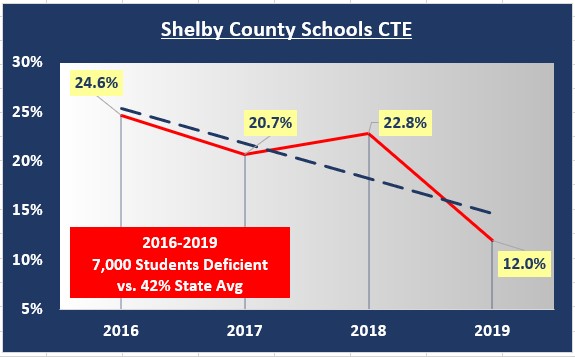
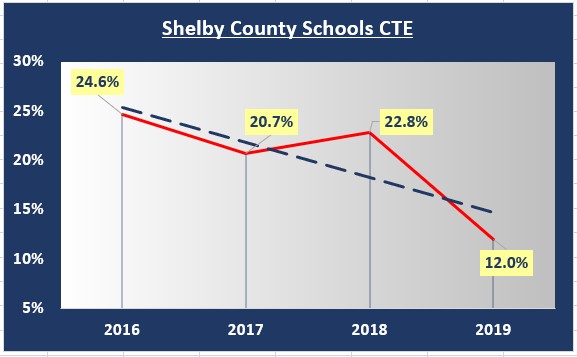
For starters, with such an aspirational Southeast leadership goal, one would think that Frist and General Assembly Education Chairs in Mark White and Brian Kelsey, would not let the high school career technical education (CTE) concentrator rate implode, in the State’s most populous and largest school district in Shelby County. But that is what they did, starting at an already miserable 24% in 2016 and dropping to 12% in 2019, per State Report Card data. 

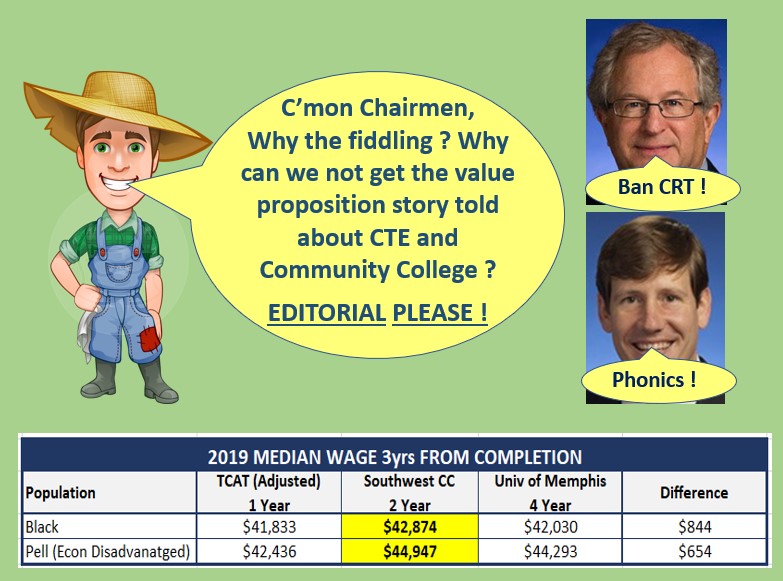
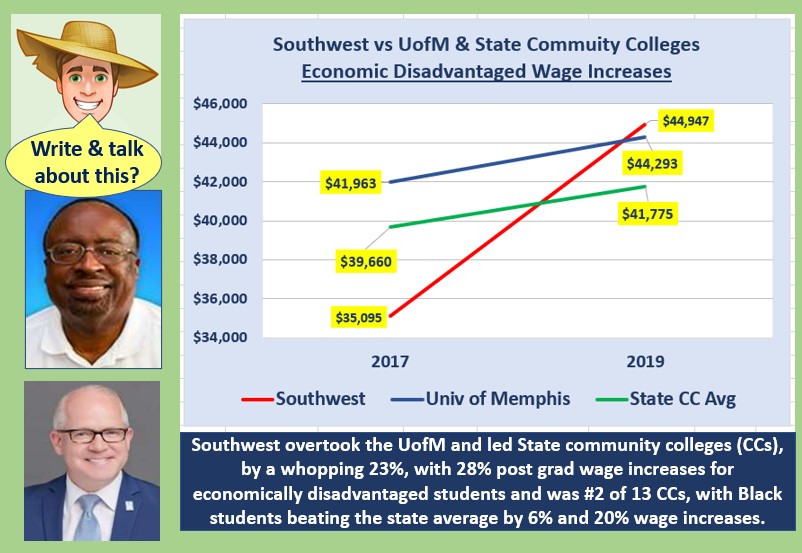
And further, from 2010-19, Shelby County’s Southwest Community College completions fell by 6% from 1124 to 1057, trailing all State of Tennessee community colleges for the period. At the same time, per a SCORE report, the labor market in Memphis is rewarding 2 yr degrees, with Southwest having 28% median wage increases since 2017, leading all State of Tennessee community colleges for economically disadvantaged students. Regarding wages for economically disadvantaged populations, there is not a better economic development story in the state! 

But with regard to completions and some further context, Pellissippi State increased completions by 158% from 793 in 2010 to 2049 in 2019. The former occurs in a Knox County, 50% the size of Shelby. And if that is not enough,  Northwest Mississippi has increased completions by 94.3% from 942 in 2010 to 1,830 in 2019.

In a nutshell, the above data observations should explain, specific workforce development challenges in Shelby County, Tennessee. What is going on? The botching of high school CTE and community colleges seems to come from the top and intentional in Shelby County !

Intentional because prioritizing high school CTE and community college is just pushed aside by SCORE and locally by the University of Memphis (UofM), with it’s new Governor HackSlam appointed Board of Trustees.

Its a horrific public result in Memphis, with a public UofM hogging public discretionary funding and the discourse from their Chamber perch, all while talking diversity and then bullying the taxpayer, in a majority Black community in need. 

But what about SCORE’s Tennessee Southeastern state leadership goals ?

State Results vs SCORE Goal

While aspiring to be #1, under Frist’s SCORE and Governor HackSlam,  the State of Tennessee has not fared well in the Southeast, as measured by IPEDS data. This occurs as SCORE celebrates the 2021 General Assembly session, with respect to their phonics and ACT WorkKeys advocacy. Phonics and ACT WorkKeys are needed but hardly innovative. 

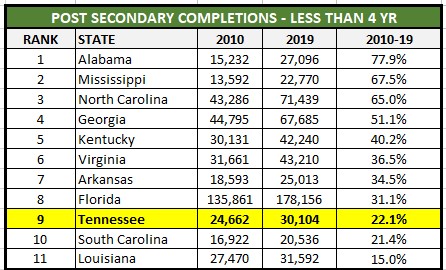
Since 2010 through pre-COVID 2019, Tennessee ranks #10 out of 11 states in overall percentage post secondary completion increases, #9 in less than 4yr and #10 in 4yr or more completions out of 11 Southeast states.

We will see if Orifice Ingram attempts to take credit for Georgia’s success in the ranking. Georgia was well on its way in Southeastern leadership in 2015 with a 34.9% increase at the time, well before Orifice’s YouScience arrived on the scene in Georgia.

As far as better aligning post secondary completion production to occupational demand, Alabama, Mississippi and North Carolina are leading the way, with the greatest percentage increases of less than 4 yr degrees.  

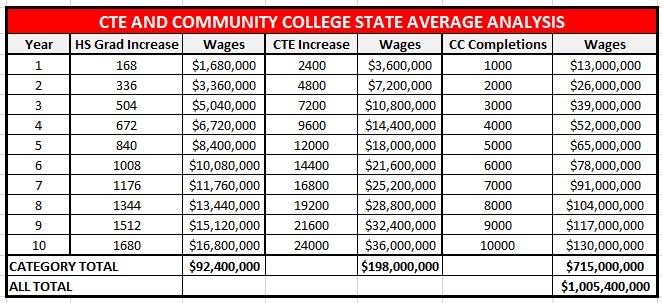
Anyway, here is the data. 


WORKFORCE: Lost Decade

August 25, 2021 Joe B. Kent Uncategorized


At a minimum, it’s a lost decade for workforce development in Memphis. With a slant toward Bachelor degree attainment, Smart City just wrote a blog  referencing 20 years of workforce hyperbole and no plan. And this blog recently documented 10 yrs of elitist botching of the workforce development system. 

The botching continues today through a narrative that prioritizes diversity and inclusion, social and emotional learning, critical race theory, UofM tennis courts and swimming pools. Does anyone find it damn weird that career technical education (CTE) and community college is not part of the local economic development narrative? 

This unfortunate narrative, accommodates an imploding Shelby County Schools CTE concentrator rate to 12% in 2019. At the same time, in spite of the former, the labor market is rewarding Southwest community college degrees with state of TN leading 2017-19 28% wage increases per aSCORE report. 

The fact is, with Shelby County ranking 9 out of 10, of the Chamber selected 10 cities in Associates and Bachelors degree production, both local Associate and Bachelor degree production needs to increase. But what should the workforce investment priorities be? Lets take a look. 

Priorities


By just bringing Shelby County Schools CTE concentrator and Southwest Community College completion rates up to state averages,  wage potential increases by $1 billion over 10 years. And $2 billion if multipliers are used. So here are the simple priorities to course correct the lost decade in Memphis/Shelby workforce development efforts:

  1. Increase the CTE concentrator rate in Shelby County Schools to at least the the state average of 42%. Why?  Regardless of concentrator post secondary enrollment rates, concentrators graduate high school at a higher rate (7%) and earn more than non-concentrators. So in this way, post secondary enrollment rates do not matter. Besides, the post secondary enrollment data is inconclusive and all over the place on the question of CTE concentrators vs non-concentrators. 
  2. Increase Southwest Community College completion rates to the state average. This would produce approximately 1,000 more completers per year.

The above table analysis assumes $10K more in wages for increased high school graduation, $1,500 more for being a high school CTE concentrator and $13K more for earning an Associates or less post secondary credential. 

And finally, prioritizing CTE and community colleges aligns with Bartik research for economic development purposes more so than investing in less tax incentives and less predictable university populations. 

UNTOLD CTE / COMMUNITY COLLEGE STORY: Editorial Please !

August 19, 2021 Joe B. Kent Uncategorized

Chairmen, what about an editorial? Given local economic development challenges and good news on the local community college level, one would think that our General Assembly Education Chairs in Rep. Mark White and Sen. Brian Kelsey might locally advocate for career technical education (CTE) and community colleges.

But not so fast. White and Kelsey are busy leading the charge on banning critical race theory, phonics and parental choice for masks. At the same time, there is good news on the workforce development front and no one is talking about it, all while the University of Memphis (UofM) hogs the discourse from within the the press corps and their Greater Memphis Chamber perch. 

Here is the good news, per a State Collaborative of Reforming Education (SCORE) report, Southwest Community College graduate annual wages have surpassed those of the University of Memphis for Black and Economically Disadvantaged students (as measured through Pell grant eligibility), respectively by $844 and $654. (See above table, where TCAT Memphis was adjusted based on only statewide TCAT data in the report)  

Sad thing is, with the UofM dominating the discourse and seemingly the discretionary local funding agenda, Memphians are ignorant of the community college value proposition. So here it is.

Given local wage data, with 2 or even 3 years less in technical college versus a university, it would take students 12 to 14 yrs to breakeven pursing a 4 yr UofM Bachelors degree versus getting a 2 yr Associates degree or less and going to work ! This conclusion was drawn, using a generous analysis, by assuming, no further education,  4% annual wage increases for 4 yr degrees and 2% for less than a 4 yr Bachelor degree. 

And the former analysis does not include any consideration of extra out of pocket expenditures that come with attending a 4 yr university. This blog is not against 4 yr or more degrees. After all, I have a UofM Bachelors and Masters degree from elsewhere. But this blog is against not educating taxpayers on the publicly funded community college value proposition. So with that, lets get the word out with even more good economic development news…..

The Best News

The news could not get any better on this “real” economic development data point.  Median annual wages for Southwest economically disadvantaged students (as defined by Pell Grant eligibility) have surpassed those at the University of Memphis by $654. This 28% increase from $35,095 in 2017 to $44,946 in 2019, leads the state and the community college state average by a whopping 23%. Its not even close and no one is talking about it !!!

The CTE and community college story remains untold in Memphis. This untold story accommodates the CTE concentrator rate in Shelby County Schools (SCS) imploding from a miserable 24% in 2016 to an absurd 12% in 2019. With SCS having 80 CTE partners, to include the Chamber and UofM, how can this even happen ? Its like the 80 partners intentionally told SCS students not to enroll in CTE. This is absurd by any measure !

The tragedy here is that CTE is often the pipeline that fuels technical and community college, and local economic development efforts for that matter. So much for accelerating wage increases for the economically disadvantaged in Memphis. 

For whatever reason, so many dwell on, Bachelors degrees for economic development. What about community college and CTE? Lets take a look. 

Increasing Economic Development Predictability – Community and Tech College

Local economic development policymakers should look to increase predictability when making public investments. Given the former, community and tech colleges provide predictability when it comes to public economic development.  Here is why.

A 2016 Tennessee Higher Education Commission (THEC) report on post graduation migration proves that Tennessee community college graduates are more likely to stay put in Tennessee than university graduates. To that extent, 87.6% of Southwest Community College (SWCC) graduates stay in Tennessee, compared with 78.7% from the University of Memphis (UofM). 

This finding corresponds with the known fact that universities are common ground for remote corporate recruitment. Of those that stay in Tennessee, as shown in the above table,  70.7% SWCC are engaged full time in Tennessee, compared with 64.7% for the UofM.

Using this data from the report and externally calculated, a productivity calculation of post graduates results of 61.9% from SWCC and 50.9% from the UofM. That is 61.9% of SWCC graduates are engaged full time in Tennessee, compared to 50.9% from the UofM.

To this extent, Tennessee public workforce development investments in community colleges are more reliable than universities, due to the post graduation migration patterns of former community college and university students.  This is not to say investments in public universities should be abandoned. But it is to say that public investments in community colleges are more predictable when it comes to economic and workforce development. 

With  a greater knowledge of post graduate migration patterns, the above findings can now be extended to interstate peer city economic development measurement, to help determine economic development variable predictability.

The below table was constructed, while ranking the Brookings/Chamber 10 selected cities across these  data categories: 2019 less than and greater than Bachelors degree completions per 1k population and 2010-19 total wage and population percentage growth.  


Reduction to post secondary completions in Indianapolis and St Louis were made, based on Indianapolis hosted statewide completion aggregation for Ivy Tech, Purdue Global online and Webster University in St Louis, with locations throughout the country. 

The 10 counties of the peer cities were then ranked for each category of population growth, Associates or less and Bachelor or above per 1K population. Rankings were then compared versus their actual total wage growth ranking. The absolute value of the variability between category rankings and total wage growth were then recorded for each city and averaged for each category. 

As expected, population growth rankings was a predictable determinant influencing total wage growth. But so was the Associates and less per 1k ranking. In fact, surprisingly in this peer ranking analysis, Associates or less completion rankings were as reliable at predicting total wage growth rankings as was population growth rankings. The average variance for population and Associates compared with total wage growth was  2.2 while Bachelors was 3.6. For predictability, the lower the variability the better.

In the table above, on the right side variance groupings, a zero variance is good. In fact, the Associate ranking accurately predicted the total wage growth ranking for 4 of the 10 peer cities. Overall, this makes sense for local public economic development investments, while referring to our prior THEC finding, as community college students are untypical targets for remote corporate recruitment, making community and tech college populations more locally economically predictable, due to decreased migration. 

To give a couple examples of the power of Associates completions, Louisville with #6 ranking and arguably a sluggish 3.4% 2010-19 population growth rate, ranked #5 in Bachelors attainment, #2 in Associate completions per 1k population, and  #2 in total wage growth at 46.6%. Another is Oklahoma City that ranked #1 in population, #7 in Bachelors, #3 in Associates and #3 in total wage growth at 42.7%.

Memphis Shelby ranked #7 in population, #9 in Bachelors, #9 in Associates and #8 in total wage growth. The former would not be good in any circumstance, but is made more painful by the educational disinvestment that has come, as a result of excessive corporate/real estate tax incentives in Memphis/Shelby County.   

All of this to say, given local economic development challenges, discretionary local public investments in UofM tennis courts and swimming pools, public parking garages and EXCESSIVE tax incentives, just should not be happening, AT ALL. 

Questions on this analysis email me at jkent@pathtrek.net

Conclusion

The facts are clear. Local economic development investments in public education and community tech colleges are reliable. If this ranking analysis is not enough, the above chart from Dr. Timothy Bartik’s research, further confirms the findings of the rankings analysis in this blog. 

Bartik’s Brooking’s featured research, is the very research the UofM and Chamber won’t discuss. The former occurs, as local workforce development is systemically botched from the top and Memphians remain ignorant of the CTE and technical college value proposition. 

Nobody in Memphis, including White and Kelsey are talking about CTE and technical college. This reality helps explain slow economic growth as opposed to the lack of a consolidated government…… 

SCS CTE

August 13, 2021 Joe B. Kent Uncategorized


Old White Dude

August 11, 2021 Joe B. Kent Uncategorized

WORKFORCE: Really, More Research ?

August 5, 2021 Joe B. Kent Uncategorized

ii

Why would anyone listen to the Chamber on workforce? This question comes after Chamber initiatives of the Greater Memphis Alliance of Competitive Workforce (GMACW), 7 years ago and Upskill 901 2 years ago, and still no connected workforce development plan.

In a Memphis Business Journal article, the Chamber’s Beverly Robertson asserted the need for more research to change the workforce narrative, all while connected workforce development implementation is non-existent. What’s stunning is the County Commission continues to rely on the Chamber and douchebag elitists for guidance in developing the workforce. 

After years of ripping off and botching the workforce development system, the elitist need to “start pukin” up millions, if not billions to rebuild the workforce development system they destroyed. “Start Pukin” is my branded solution platform to solve an array of local challenges. 

Given these challenges, in many cases, no research is needed. Answers are in plain sight starting with the 12% Career Technical Education (CTE) concentrator rate in Shelby County Schools. A student is considered to be a CTE concentrator if they have completed at least 2 CTE courses (formerly known as vocational courses) in a single career pathway. 

Another huge gap is the seeming omission of vocational community colleges in the local workforce development discussion. K-12 and Universities are regularly featured in local public proceedings but not Southwest and the Tennessee College of Applied Technology (TCAT). In a recent Leadership Memphis webcast on workforce, neither Southwest, TCAT or Moore Tech were represented, leaving a massive gap in the discussion. 

All of this to say, increasing CTE enrollment and post-secondary 2 year and less degrees is paramount to successful economic development efforts. 

More on CTE


To summarize the table above, the CTE concentrator rate, per the State of TN report card in 2019 was 41.7% statewide. Arlington, Bartlett, Millington, Collierville and Germantown collectively had a 33.5% CTE concentrator rate with Shelby County Schools (SCS) at an abysmal 12%. SCS declined by 40%, in percentage terms, in 2018 from 20% to a 12% CTE concentrator rate. What happened ?

I don’t blame SCS for the low CTE concentrator rate. After all, there was supposed to be a number of “partnerships” to help propel SCS workforce and economic development programming over the years, that never seemed to happen for one reason or another. Like early literacy, CTE should be locally thematic, but it isn’t, fundamentally squandering economic development efforts. 

The Shelby County Schools CCTE website lists almost 80 partners that consists seemingly of every known entity in Memphis. This listing begs the question, “what did the partners do, tell students not to enroll in CTE?”

Its understandable why an urban school district would have below average ACT academic scores, but a 12% CTE concentrator rate ? Occupational demand easily supports a CTE concentrator rate at 50% or above. Such a rate is good for economic development as it is aligned with employer demand. 

Anyway, based on a State Report Card cohort of 7,900 students, increasing  the CTE concentrator rate to the state average of 41.7% would increase the SCS high school graduation rate by 2% or 164 students and annual post-secondary enrollment by 234.

This is based on this Congressional report that reveals that CTE concentrators have a 7% higher high school graduation and 10% higher post secondary enrollment rate as compared to non CTE concentrators. 

While there is a ton of work to do, having a connected workforce development system plan, not decreasing and increasing the SCS CTE concentrator rate and regularly engaging vocational community colleges is where we are at…..

Pages

  • ABOUT
  • Attribution
  • CONTACT
  • CRISIS IN SYSTEM CONFIDENCE
  • DAILY MEMPHIAN: Actively Censoring Free Speech
  • DATA: For Shelby County Macroeconomic Analysis
  • DEFICIENT ECONOMIC DEVELOPMENT – TAXPAYER LOSS
  • Economic Development Growth Engine (EDGE)
    • EDGE Public Comment – 06/20/18
  • EDGE Retention PILOT Program (A Memphis Tomorrow Bi-Product)
    • Existing and Additional Facility Capital Investment (3)
    • Existing Facility Retention PILOT Capital Investment (7)
    • Local Facility Relocation (3)
    • New and Existing Facility Capital Investment (1)
    • New Facility and Consolidation from West Memphis (2)
    • New Facility Capital Investment (2)
  • Educational Attainment Requirements by Geography
  • Greater Memphis Alliance for Competitive Workforce (GMACW)
  • Implement
  • IT’S WEIRD
  • Median Age vs Memphis Peers
  • Memphis Chamber of Commerce
  • Memphis Raise Your Expectations (MRYE) Economic Development #BalanceMemphis
  • Memphis Tomorrow Executive Committee – $124M in taxpayer shortfalls
  • MRYE Memphis Economic Development Survey
  • MWBE DASHBOARD
  • PUBLIC PARKING PORN
  • RESOURCES
    • Memphis City Council Attempted Comment Not Heard – 06/19/18
  • SOLUTION
  • What Does $124M Look Like in Community Benefit ?
  • WORKFORCE: Lost Decade

Archives

  • April 2022
  • February 2022
  • January 2022
  • December 2021
  • November 2021
  • October 2021
  • September 2021
  • August 2021
  • July 2021
  • June 2021
  • May 2021
  • April 2021
  • March 2021
  • February 2021
  • January 2021
  • December 2020
  • November 2020
  • October 2020
  • September 2020
  • August 2020
  • July 2020
  • June 2020
  • May 2020
  • April 2020
  • March 2020
  • February 2020
  • January 2020
  • December 2019
  • November 2019
  • October 2019
  • September 2019
  • August 2019
  • July 2019
  • June 2019
  • May 2019
  • April 2019
  • March 2019
  • February 2019
  • January 2019
  • December 2018
  • November 2018
  • October 2018
  • September 2018
  • August 2018
  • July 2018
  • June 2018

Categories

  • Chamber Alliance (1)
  • City Council (4)
  • County Commission (3)
  • Economic Development (1)
  • EDGE (2)
  • Memphis Tomorrow (2)
  • Public Comment (7)
  • Strip (1)
  • Uncategorized (269)

WordPress

  • Log in
  • WordPress

Subscribe

  • Entries (RSS)
  • Comments (RSS)

Pages

  • ABOUT
  • Attribution
  • CONTACT
  • CRISIS IN SYSTEM CONFIDENCE
  • DAILY MEMPHIAN: Actively Censoring Free Speech
  • DATA: For Shelby County Macroeconomic Analysis
  • DEFICIENT ECONOMIC DEVELOPMENT – TAXPAYER LOSS
  • Economic Development Growth Engine (EDGE)
    • EDGE Public Comment – 06/20/18
  • EDGE Retention PILOT Program (A Memphis Tomorrow Bi-Product)
    • Existing and Additional Facility Capital Investment (3)
    • Existing Facility Retention PILOT Capital Investment (7)
    • Local Facility Relocation (3)
    • New and Existing Facility Capital Investment (1)
    • New Facility and Consolidation from West Memphis (2)
    • New Facility Capital Investment (2)
  • Educational Attainment Requirements by Geography
  • Greater Memphis Alliance for Competitive Workforce (GMACW)
  • Implement
  • IT’S WEIRD
  • Median Age vs Memphis Peers
  • Memphis Chamber of Commerce
  • Memphis Raise Your Expectations (MRYE) Economic Development #BalanceMemphis
  • Memphis Tomorrow Executive Committee – $124M in taxpayer shortfalls
  • MRYE Memphis Economic Development Survey
  • MWBE DASHBOARD
  • PUBLIC PARKING PORN
  • RESOURCES
    • Memphis City Council Attempted Comment Not Heard – 06/19/18
  • SOLUTION
  • What Does $124M Look Like in Community Benefit ?
  • WORKFORCE: Lost Decade

Archives

  • April 2022
  • February 2022
  • January 2022
  • December 2021
  • November 2021
  • October 2021
  • September 2021
  • August 2021
  • July 2021
  • June 2021
  • May 2021
  • April 2021
  • March 2021
  • February 2021
  • January 2021
  • December 2020
  • November 2020
  • October 2020
  • September 2020
  • August 2020
  • July 2020
  • June 2020
  • May 2020
  • April 2020
  • March 2020
  • February 2020
  • January 2020
  • December 2019
  • November 2019
  • October 2019
  • September 2019
  • August 2019
  • July 2019
  • June 2019
  • May 2019
  • April 2019
  • March 2019
  • February 2019
  • January 2019
  • December 2018
  • November 2018
  • October 2018
  • September 2018
  • August 2018
  • July 2018
  • June 2018

Categories

  • Chamber Alliance (1)
  • City Council (4)
  • County Commission (3)
  • Economic Development (1)
  • EDGE (2)
  • Memphis Tomorrow (2)
  • Public Comment (7)
  • Strip (1)
  • Uncategorized (269)

WordPress

  • Log in
  • WordPress

CyberChimps WordPress Themes

© MCCL