FOCUS – A Roadmap For Transforming The Metro Memphis Economy is the prevailing economic development plan in Memphis. The 2014 plan is the product of the Memphis and Shelby County Regional Economic Development Plan Steering Committee Co-Chaired by former Mayor A.C. Wharton, Shelby County Mayor Mark Luttrell and Christine Richards, formerly Chief Counsel for FedEx. The planning project was managed by the Economic Development Growth Engine (EDGE) and the steering committee consisted of representatives from education, industry and local government.The executive summary of the plan states:
“Focus: A Roadmap for Transforming the Metro Memphis Economy will reestablish its steering committee under the umbrella of Memphis Fast Forward, adding more industry leaders and representation from diverse stakeholders to guide implementation. In coordinating action with key partners to ensure alignment, leadership will establish performance metrics, track progress, and hold partners accountable as implementation moves forward. It will build ongoing capacity for market analysis, identifying opportunities and prioritizing next steps.“
With the former stated, it does not appear that metrics or progress monitoring was ever established. Brookings FOCUS is never publicly discussed nor does it ever appear on local legislative agendas. At the same time, local government is spending over $60M per year on economic development without any defined economic development metrics or progress monitoring. So how can Brookings FOCUS be measured ?
Brookings FOCUS did lay out key findings in four challenged areas. Those findings are: 1) economic diversification away from logistics, 2) improving workforce through increased educational attainment, 3) increase support for entrpreneurs, startups and small business and 4) increase employment density in the urban core. Given these key findings, metrics can be applied to measure the effectiveness of the Bookings FOCUS plan.
Diversification Away From Logistics
The Bureau of Labor and Statistics (BLS) Quarterly Census of Employment Wages (QCEW) program can be used to measure industrial diversification using location quotients (LQ). LQs measure the concentration of a variable, in this case industrial wages, as compared to the nation. The Brookings FOCUS plan discusses remaining the national leader in logistics but diversifying the economy away from logistics.
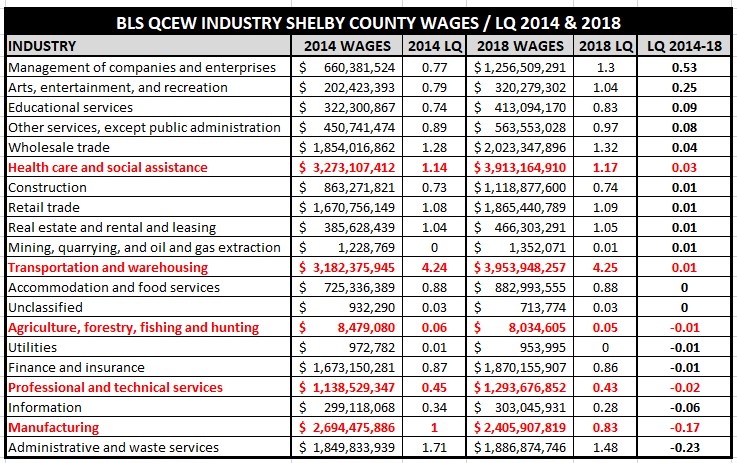
The plan also mentions target sectors for growth which include biologistics, biotechnology, medical devices and agriculture. Using LQ, industrial diversification through total wages paid can be measured since 2014 using 2018 industrial wage data. Target areas mentioned are in red as found in the table below. Healthcare LQ from which some of the planned target economic activity would take place, grew in LQ by .03 while other target areas decreased in agriculture by .01, professional and technical services by .02 and most concerning manufacturing by .17.
As far as the industry target goal for LQ decrease in transportation logistics, it actually increased by .01. See the below table for all industries:
Economic diversification efforts could better be served by more public measurement and progress monitoring.
Workforce – Educational Attainment
Educational attainment can be measured using data from Integrated Postsecondary Education Data System (IPEDS). Using IPEDS, educational attainment levels can be compared to peer city competitors. To adjust for population variances between 15 peer counties, a population factor can be applied to peer economic competetitors actual postecondary completions. In this way, actual completers in a larger county such as Charlotte Mecklenburg County are reduced whereas program completions for a smaller geography such as Little Rock Pulaski County are increased.
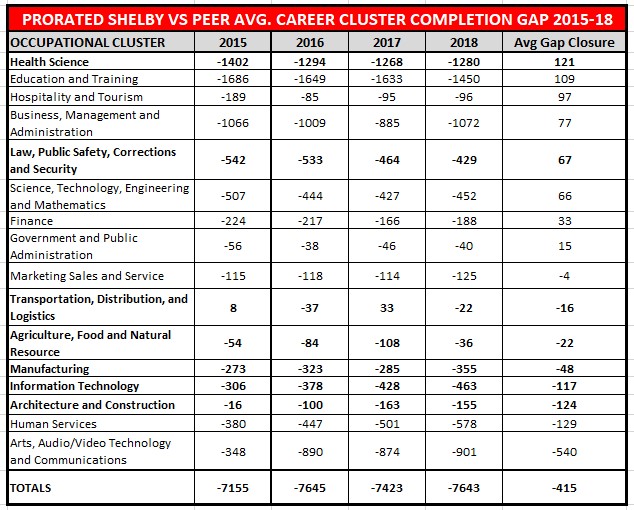
Given this methodology, average prorated for population postsecondary completions for occupational clusters can be derived. Benchmarked from 2015, the below table shows the Shelby County gap from the prorated occupational cluster peer average. The column on the far right shows the average gap closure across 2016, 2017 and 2018. The 2014 Brookings FOCUS plan states:
In the first phase of implementation, the region will strengthen its workforce development system to prepare more workers for next economy jobs. The Greater Memphis Alliance for a Competitive Workforce will leverage new state programs that expand access to community colleges and training and strengthen alignment with regional employers and real-world skill requirements.
Using IPEDS data, the below table data shows the Shelby County progress of increasing postsecondary completions from 2014. A negative number reflects below prorate peer average completions. Bright spots in completion rates can be found in Health Science where the average gap closure across 3 years was 121 and Law, Public Safety, Corrections and Security at 67.
At the same time, in demand occupational clusters of Transportation average gap across 3 years increased by 16, Agriculture by 22, Manufacturing by 48, Information Technology by 117 and Architecture/Construction by 124.
Overall, the prorated postsecondary completion gap from 2015-18 increased by an average of 415 for all occupational clusters. Postsecondary completions overall, need to increase by approximately 7,500 per year to achieve peer average postsecondary completions.
Workforce development efforts could better be served by more informed public measurement and regular progress monitoring.
Increase Support for Entrepreneurs, Startups and Small Business
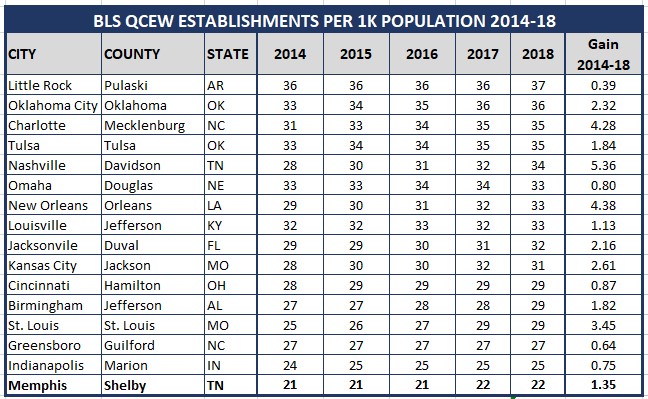
Since most businesses are small business, the best measure for small business vitality is BLS QCEW establishments. Using BLS QCEW data, the number of business establishments per 1K population can be derived. Memphis ranks last among 15 peers in the number of establishments per 1K population. The gain since the release of the Brookings FOCUS plan can be found in the far right column.
The average 2014-18 gain for business establishments per 1K population was 2.13. The Shelby County gain from 2014-18 was 1.35 per 1K population. Additionally, on the legislative public record concerns can be found related to the lack of support for locally owned small businesses (LOSBs). Based on the data, there appears to be a lack of establishment cultural support for LOSBs. See below table data:
Small business can best be supported by first increasing the transactional velocity with LOSBs while secondarily supplementing small business development with business planning advice and collaborative space. Further small business development efforts could better be served by more informed public measurement and regular progress monitoring.
Increase Employment Density In The Urban Core
Based on the data, the primary tool for increasing employment has been tax incentives based on the Northern Mississippi threat with less focus on workforce and small business development. Employment gains have been locally thwarted by unprepared workforce and public transit. The Brookings FOCUS plan states:
Tax advantages and aggressive incentive packages in northern Mississippi have accelerated the outward growth pattern, luring firms to relocate within the region and increasing both segregation and disinvestment in older areas.
Given the above, the effectiveness of Brookings FOCUS and local tax incentives can best be measured using BLS QCEW employment percentage gain and actual job increase data while benchmarking overall EDGE job incentives versus peer competitors.
Shelby County employment gains from 2014 to 2018 trail the peer average by approximately 1% or 5K filled jobs. Shelby County employment growth from 2014-18 was 4.83% compared to the peer average at 5.75%. And since EDGE began, employment growth trails the peer average by 4.4% or 20K filled jobs. At the same time, local job incentives are some $500M+ since 2011 while using incomplete accounting which has been externally questioned by The Beacon Center of Tennessee.
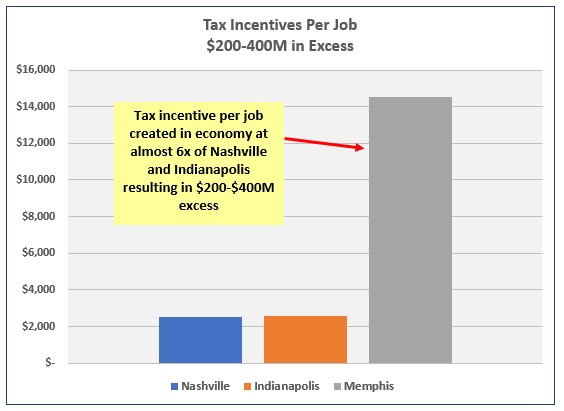
Based on this information, tax incentives can be benchmarked against 2 peer cities in Nashville and Indianapolis to show that Memphis/Shelby is paying about $14K per filled job in incentives versus Nashville and Indianapolis at approximately $2.5K per job. This results in $200-400M in excess job tax incentives which take away from investments that support workforce and small business and are the primary driver of any local economy.
Conclusion
Economic development efforts can better be served by more informed public measurement and regular progress monitoring.


