
The most recent publication of the University of Memphis Poverty Fact Sheet seemed rushed. And there remains significant questions with some stunning underlying statistics that drove the change, like a single year decrease of 38K Memphis Blacks in poverty. Do what ?!?!
Recent reporting by the UofM partner, in the Daily Memphian, cited greatly improved poverty statistics forthcoming in the now released Poverty Fact Sheet. This coincided with further local reporting of a new UofM / Greater Memphis Chamber partnership. The challenge with such reporting, without deeper analysis, is that it may unfortunately protect the directional status quo of locally deficient economic development efforts.
Used widely, the Poverty Fact Sheet is a a healthy local innovation by Dr. Elena Delavega of the University of Memphis. Delavega first produced the Fact Sheet in 2012, prior to the 2016 installment of the new largely local corporate UofM Board of Trustees.
Seemingly rushed, with barely released Census estimates, the math in the Daily Memphian article, pertaining to City of Memphis poverty statistics, made no sense and social media erupted. The article stated a 21.9% improvement in the City of Memphis poverty rate with subgroup percentages not supporting the overall increase.
Folks naturally had questions, regarding a drastically improved poverty rate with no great inflow of new jobs or meaningful uptick in average wages (BLS) and virtually flat local tax revenues Pre-COVID.
Again, without the visionary innovation of the Poverty Fact Sheet by Dr. Delavega, this blog would not be happening nor would many local conversations regarding poverty. But the drastic improvement in the poverty rate, as mostly stagnant conditions persist, led this blog to search for answers.
And the answers are in the United States Census data that Delavega uses for the Poverty Fact Sheet. At the same time, this blog could not find agreement between the published Census data and the population data in the Delavega Poverty Fact Sheet for the City of Memphis, Shelby County and MSA. Perhaps there is a rationale for this discrepancy.
On the other hand, the poverty rates from the Census data, as contained in this blog and the Poverty Fact Sheet, match up. With that stated, could Dr. Delavega, please provide the population figures used to calculate the poverty rates to this blog ? Let’s see what is in the data:
Memphis Poverty Data
The below values are taken directly from the 2018-19 Census tables. The percentages are externally calculated values from the Census provided data.

Based on the United States Census Data above and shaded in black, drastic improvement in the City of Memphis Black poverty rate, drove rate improvement for all of the City of Memphis, County and Tri-State MSA region. Primary findings from the data are above and summarized below:
In 2019, Blacks in poverty in the City of Memphis decreased by a whopping 37,749 from 141,980 to 104,231. The Black poverty rate in Memphis decreased by 22.7% from 33.8% to 26.1%. The 37,749 drop dwarfed next in line in Philadelphia, which had an 18K decrease in Black poverty and has about a 50% larger Black population than Memphis. The drastically lower Black poverty population is the numerator in calculating the percentage poverty rate.
From 2010 to 2019, the 2019 38K City of Memphis decrease in Black poverty, dwarfed all cities with large Black populations. Based on cities with at least 100K in Black population and 30% Black, the next greatest decrease, was again The City of Philadelphia in 2017 at 22.6K and Chicago at 20.4K in 2018. In fact, the 2019 City of Memphis decrease of 38K dwarfed even the entire Philadelphia MSA at 27.5K which has a Black population 3 times the size of Memphis at 1.2M.
In 2019, City of Memphis Black Population decreased by 20,913 or 5%, from 420,403 to 399,490. White population in the City of Memphis increased by 16,078 or 9.1%, from 177,118 to 193,196. The County only shows losing 4,364 in Black population. The lower Black population is the denominator in calculating the poverty rate.
While the rate decreased for Whites, the actual number of Whites in poverty increased in Memphis by 1,469.
The Hispanic poverty rate increased by 1.1% in Memphis, while falling in the MSA.
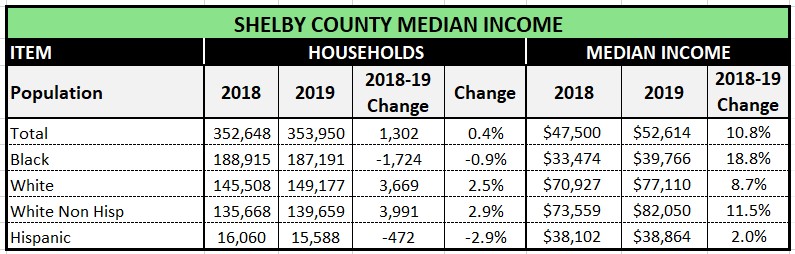
Shelby County Data
The below values are taken directly from the 2018-19 Census tables. The percentages are externally calculated values from the Census provided data.
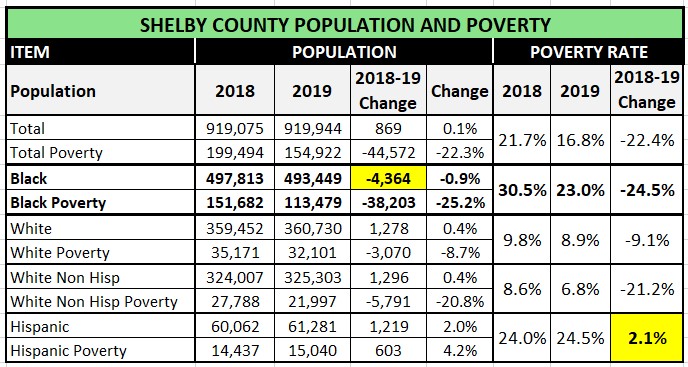
Again, the Shelby County data, was largely driven by The City of Memphis data.
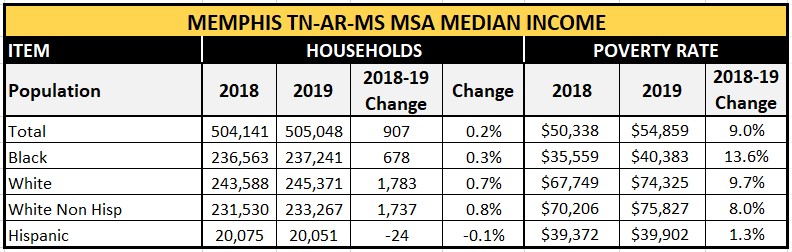
Memphis TN-AR-MS MSA Data
The below values are taken directly from the 2018-19 Census tables. The percentages are externally calculated values from the Census provided data.
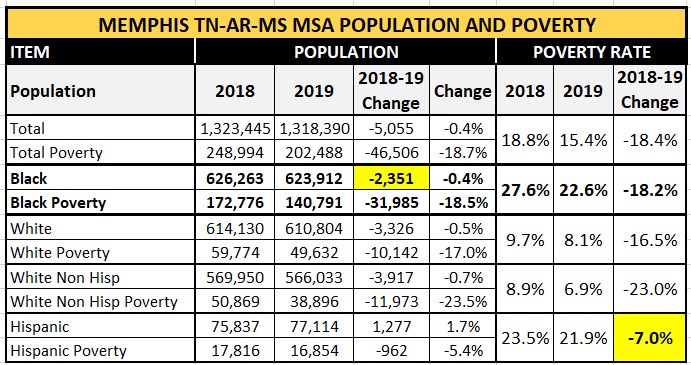
These are some concluding findings regarding Shelby County and the MSA:
While the Hispanic poverty rate increased for both Memphis and Shelby County, it decreased in the MSA by 7%, from 23.5% to 21.9%
After Memphis lost 21K in Black population, Shelby County lost 4,364 and the MSA 2,351. That implies that Blacks moved out of the City of Memphis and remained in the County or in the MSA.
This above implies that approximately 16.5K Blacks moved out of the City but stayed in the County while another 2K moved into other parts of the MSA outside of Shelby County and 2.5K moved out of the MSA altogether.
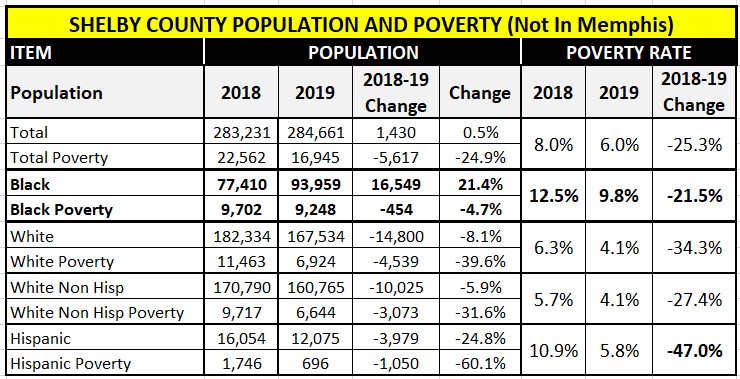
Below are statistics for populations outside of Memphis.
Shelby Residents (Outside of Memphis)
This table contains externally calculated values derived from the 2018-19 Census Estimates.
Memphis MSA Residents (Outside of Shelby County)
This table contains externally calculated values derived from the 2018-19 Census Estimates.

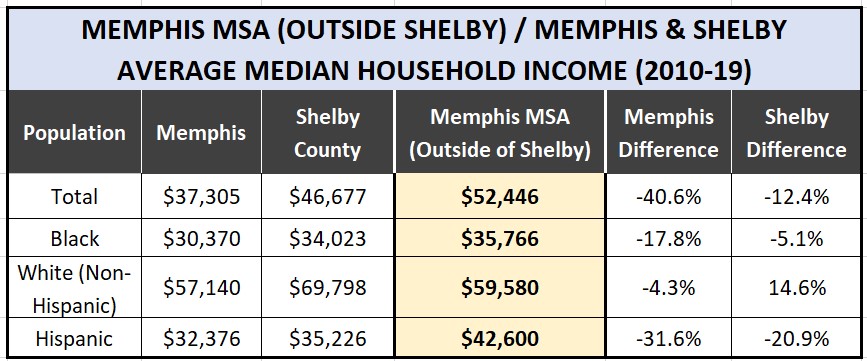
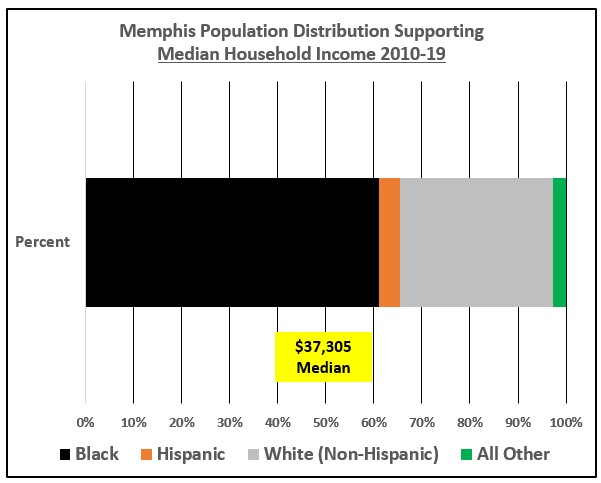
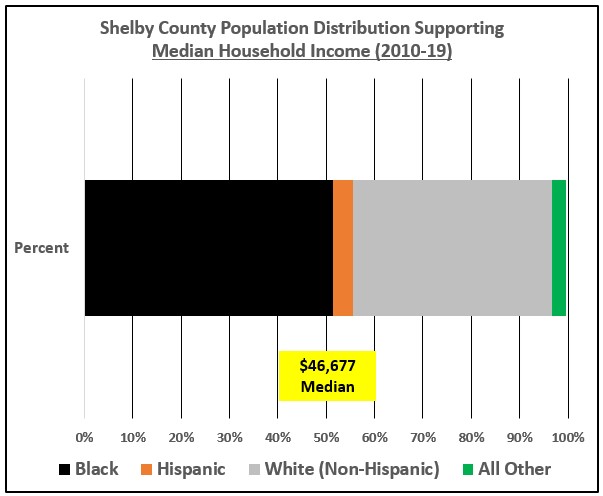
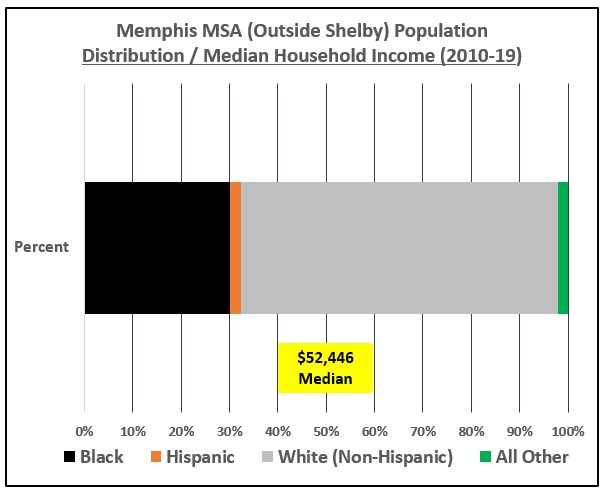
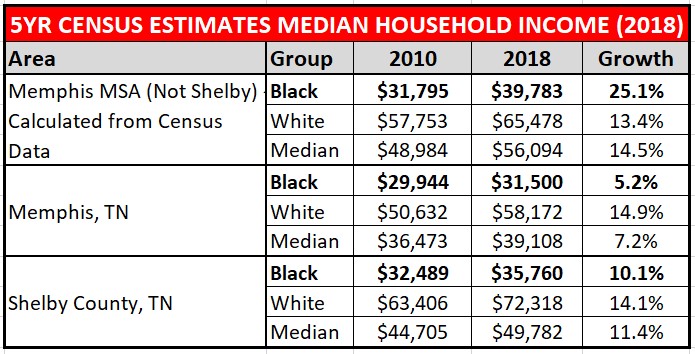
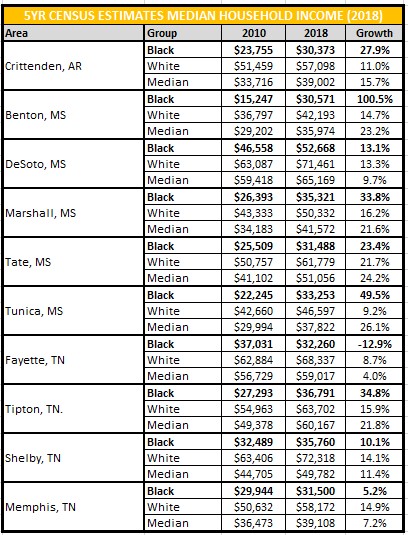
Median Income
The below values are taken directly from the 2018-19 Census tables. The percentages are externally calculated values from the Census provided data.

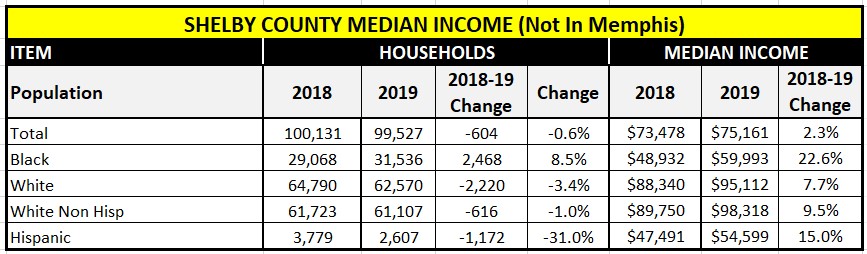
Shelby County (Not In Memphis)
This table contains externally calculated values derived from the 2018-19 Census Estimates.
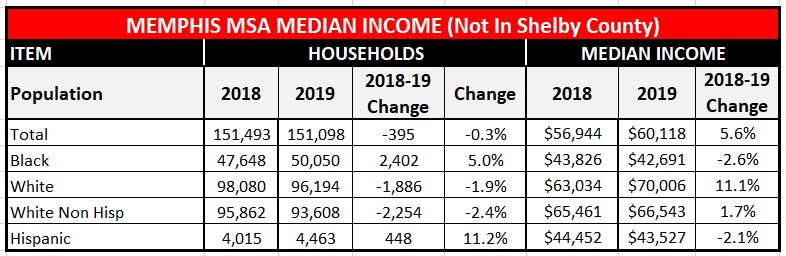
Memphis MSA (Not In Shelby County)
This table contains externally calculated values derived from the 2018-19 Census Estimates.
Memphis MSA vs Memphis/Shelby Median Household Income
Conclusion
Drastic changes in calculated rates, of any sort, most often need the underlying values to explain the causes for drastic changes. Without it, taxpayers and policymakers will potentially be misinformed.


